"If you can't measure it, you can't improve it". This quote comes from Peter Drucker, one of the most prolific business thinkers of the last century. Then you have those that say that "half the money I spend on advertising is wasted; the trouble is I don't know which half". The latter quote comes from merchant, religious leader, and political figure John Wanamaker, a successful business leader that saw success in the late 1800s. Mark Twain famously popularised the sentiment that “there are three kinds of lies: lies, damned lies, and statistics”. Fast forward to the modern age and there is no doubt that Wanamaker would find his answers... and the others would likely revise their sentiment. However, almost 100 years after Wanamaker's death, and with all the declared digital insights that we now have access to, we still hear some of those wayward quotes in corporate and mainstream marketing rhetoric from time-to-time. Even worse is when marketing representation has some understanding of how important data is to a customer journey yet ignores it because they don't have the capacity to record it, act upon it, or even fully understand it.
You may have heard the competing arguments supporting and dismissing the notion that "if you can't measure it, you can't manage it." While it is true that you can manage and improve upon processes without data, digital marketing relies heavily upon highly measurable and actionable real-time information in order to optimise your ROI. Digital statistics aren’t biased, they don’t lie, and they’re always accurate.
The importance of what we’ve just discussed is done so to express the modern day importance of insights associated with your marketing efforts (and to understand where the misinformed opinions are rooted). For example, we still hear of marketing groups tell brokers they don’t need a website (the source of some of your most valuable marketing data)... and this professionally negligent advice is nonsensical in every respect (it's why we give you a website at no cost). A website is the centerpiece of any marketing funnel experience and provides a bucket-load of data which is absolutely necessary in order shape any one user's unique funnel journey. If your marketing representation has failed to integrate your website with your digital experience then they've objectively failed you... and it's time to sit them down for some farewell tea and bickies.
Examples of Integrated Data
Yabber includes over 1500 graphs and tables to property represent your campaign and digital data, so it's not feasible nor reasonable to include them all in this article. Instead, we've selected just a few of the bigger ticket and more common elements you're likely familiar with. Email campaign data, landing page data, and associated engagement data (website traffic, links, downloads etc.) are all extremely extensive. If there's a consumer touch-point with any of your marketing assets we need to know what it was in order to optimise your customer and funnel experience.
This article introduces the basics of the broad data insights available via Yabber  , and how this data will guide decisions - manual or automated - into optimising your funnel experiences.
Website Statistics
Yabber provides for the management of multiple websites with data and insights provided for each site in your network. The statistics we record make it easy to understanding how each user on your site traverses each resource, and what components of your website or specific marketing assets work better than others (and what website funnels or paths lead to conversions).
Pictured: Basic website statistics as presented to a user. Yabber is a multi-website system so each site may be assessed independently or grouped with other websites. The basic entry summary page shows top referring websites, most viewed posts or pages, popular internal referrers, conversion ratios for all pages and landing pages, most common conversion types, location data, global conversion data, daily and weekly page views, and all site actions (views, conversions etc.). This data is vital to our conditional understanding of your traffic (each page or link carries an 'interest' type that feeds our understanding of your audience). This is an actual broker website chosen because his relatively low traffic of just 200 unique visitors a day returns his business over 150-million (projected) in organic volume per year, and he's yet to introduce the high-converting video components or even launch a single paid campaign (the importance of SEO and on-page conversions is discussed in upcoming articles). You will note the very low visitation before he introduced our SEO and page conversion systems.
Belief's analytics are connected in a way that isn’t typically experienced or even available in the consumer market. Our Platform enables us – by way of connected email, website, landing pages, and links – to build statistical reports that tell us precisely how our audience is connecting to our marketing efforts and how each user is behaving across all our digital assets. Belief’s systems leave no room for assumptions or guesswork. As introduced later, we record internal website page views, internal web clicks, and virtually any other user interaction – all with user details attached - and we employ a conditional methodology to alter the content of your website to cater for the specific type of audience that is visiting your site, or we can use the resolved data to alter the page content for a specific user based on what we know that use is looking to find. This enterprise-level and high-level funnel pressure is only made available by virtue of the massive amounts of data our systems collect on each funnel participant regardless of where they are in their customer journey (if this sounds new to you it's because Belief provides the only integrated digital system available in the finance market).
Internal Website Link Statistics
Every website visit creates a unique user footprint or on-site funnel that paints a clear picture of how a user moves around your website; it's for this reason that we don't just record generic page visits, but we record visits for each specific and identifiable website visitor. We define on-site navigation as a Website Funnel and we're constantly looking at what pathways were taken by any user that resulted in a conversion (or bounce) in order to improve upon site effectiveness. Data is pointless unless the information tells a story or paints a picture, and our statistics are designed to inform us of precise website behaviour.
Internal links clicks are the primary means upon which a user bounces from one page to another so they provide tactile feedback on what path is taken to any kind of 'conclusion'. The data is invaluable.
Pictured: The above panel shows link clicks within your website. Links are an important means of establishing user interest type, and assigning an escalation to their funnel experience. Any link within your website can have an associated trigger attached (itself a seriously impressive trove of data). In addition to website link clicks, and as part of the broader linking framework, we record all links and link counts associated with each page (in addition to YouTube and other video links) in order to build an internal linking structure for SEO purposes. The screenshot above shows top link clicks (an ideal and immediate means of identifying what content is 'working' on your site), geography, Page Click Ration (PCR, both unique and global), link clicks per hour, per day and weekly. In addition you can review in real-time what links are being clicked and who is clicking on them (identifying information is provided). The graph above shows around 1750 link clicks per day (this belongs to a top-performing broker). Obviously link clicks mean nothing unless you convert of cold traffic, and our website is designed to facilitate massive conversions. The PCR (Click Ratio) metric is important and one that we constantly seek to improve upon; there's a balance between the number of clicks and the time it may take for a user to subscribe to us, call us, or subscribe to an online asset.
Your website's internal linking framework is a large component of our SEO module and will be introduced here. Linking structure means nothing unless we're able to measure each link against actual engagement... and since our system is integrated we provide a depth of data that others cannot. If you can't measure it - you can't improve upon it... and linking is one area where we provide essential on-page feedback.
It's widely recognised that we manufacture and support the highest yield Facebook experience in the industry... and this article details (in part) why and how that's possible. If you're ever investing a budget into paid promotion you absolutely have to garnish real-time feedback on how that investment is performing. Additionally, our AI System requires real-time data in order to provide the necessary course-corrections or, in some cases, shut down poor-performing campaigns completely.
Facebook Marketing Statistics
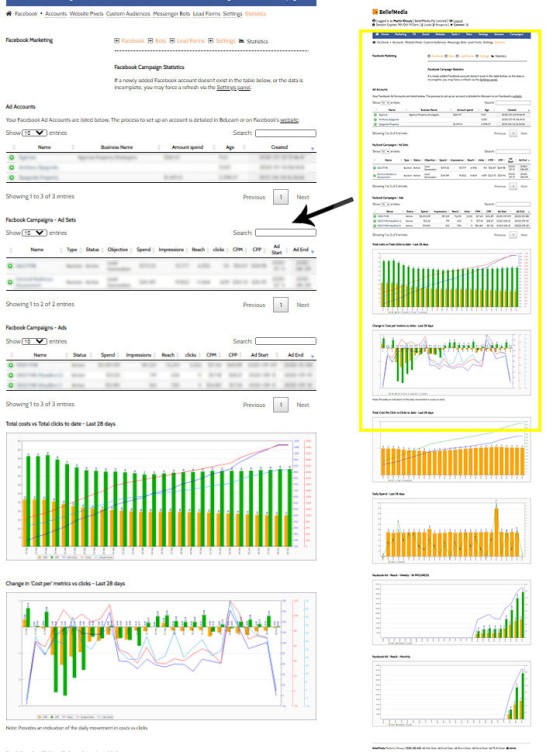
We're asked all the time why our Facebook ads and programs perform far better than others in the market, and there are a large number of reasons for this. The creativity and copy aside, we don't dissociate your Facebook systems with other connected systems - it's fully integrated with all other supporting systems meaning that your advertising is better informed and crafted to convert. This means your Facebook campaigns are guided by the success (or failure) of those ancillary systems that are intrinsically connected to the broader Facebook experience.
Pictured: One general component of our integrated Facebook statistics. The integration is essential in order to drive successful campaigns since the campaign itself is predicated upon multiple systems working in complete unison. Any fragmented component or disconnected system will simply diminish results. In order for our AI engine to match the success of a campaign against triggers, emails, landing pages etc., it requires access to all data associated with a campaign - not just basic costing data as provided by Facebook.
Quantifiable, measurable, and easily understood real-time data is the cornerstone of all digital programs. While data-based strategy formulation is commonplace in high-end digital circles it is often ignored by way of bias or choice by the finance community (this applies to best-practice offline SOPs as well). Every minute of your day has to be accounted for and the results of that minute should yield a measurable return. The same principles apply for every cent you drop into your marketing efforts - guesswork and assumptions are far less applicable to modern-day marketing that ever before, and applied behaviour analysis and a meta-data approach is now fundamental to the marketing ideologies and practice.
Downloads Statistics
In this day and age we still see businesses host their downloads on their website or, even worse, Google Drive or similar. The data obtained from a single download, and the potential to further engage a user by way of triggers or course corrections, on the basis of a download is completely negated when you don't fully integrate your digital downloadable assets. The following graph shows some of the downloads from a typical higher-performing broker website (averaging around 60 downloads per day). Again, with a quick glance at your summary screen - and without the assistance of any of our other data insight tools - you're able to quickly identify better performing assets so you're able to assign more time to that particular area.
Pictured: The version-controlled download management system is extensive (of course the version control is required by way of legislation). Any document created via our automated white-label branding tool (material we feed into the system) is automatically assigned to your library and available in forms, pages etc. The basic statistics includes popular downloads, referring websites, top referring domains, daily and weekly downloads, and a log of each individual download with user information attached. Each download may be assigned a trigger for funnel escalation. This broker is averaging around 150 downloads per day - how do your efforts compare?
Not providing a hosted and trackable download system is a staple of digital mediocrity. If your representation has ever suggested hosting anywhere other than an environment that provides a deep understanding of engagement via statistics and other data, it's time to look elsewhere.
Telecommunication Logs
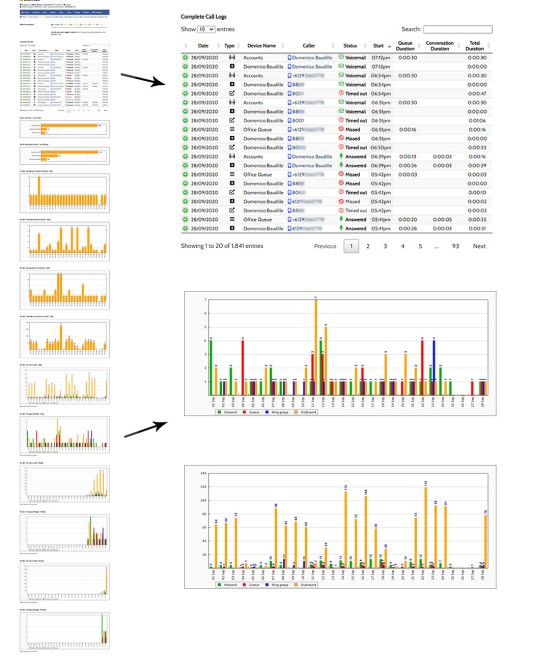
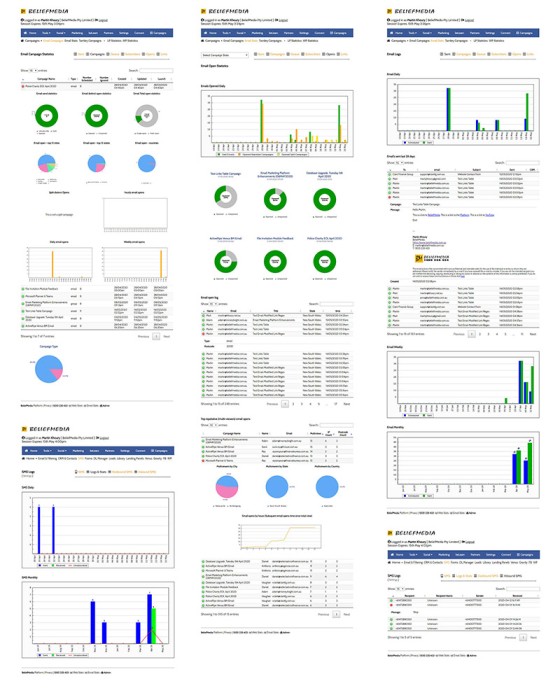
The telecommunication integration via our Jabber service is a big module, and it's one of two modules that incurs an additional fee. Integration of your internal telecommunication into your marketing provides next-generation online and offline insights that would otherwise be ignored. Discussed in more detail here, all logs, recordings, voicemails, and so on, all contribute towards an understanding of how your time is managed, and how your marketing is performing. Another standalone system provides data and engagement statistics for SMS communications.
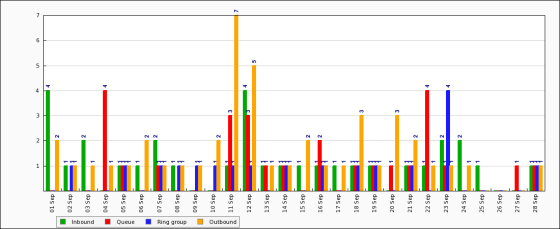
Pictured: On of the many pages showing call tables with basic stats. Call times, wait times, queue times are all recorded on a per user and aggregated basis. Phone calls to any number can generally be launched from within the Platform - handy when completing Jupiter, Pluto, or Saturn programs. For compliance purposes all calls and voicemails are recorded. Because the system is a true PBX setup we support IVR (Interactive Voice Response), time of day routing, geographic routing, simultaneous ring, sequential ring, Microsoft Teams integration, multiple numbers, and more. Because the system is integrated we create extensive statistical reporting to graph the success of your offline communications.
Subscribers
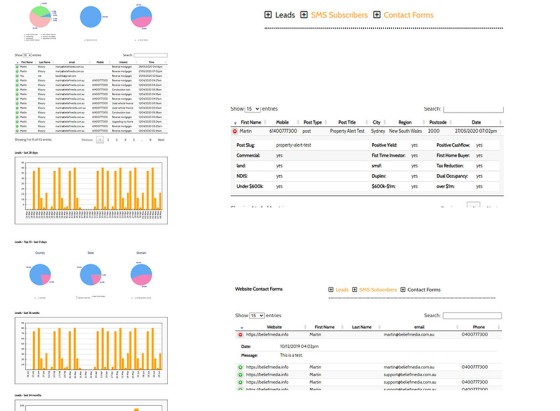
Subscriber statistics are rather vanilla in nature, in that they're somewhat of an unremarkable feature. However, they're absolutely necessary in order to feed other parts of our system because they represent the 'end game' - the number of people ingested into your funnel (remembering the primary stats are associated with clients that actually called us).
Pictured: Subscriber statistics. The system is heavily integrated with other systems, such as email, text messaging, planner, CRMs, and other systems. We consider Yabber to be a 'PRM' or 'Prospect Relationship Management' tool. The goal is to attract and convert business - your primary CRM will support them as Opportunities.
Email Marketing
Email is obviously at the heart of any digital system, and our fully compliant and Microsoft-driven enterprise-level email marketing solution provides vital statistics so you're able to quickly and easily assess the performance of any campaign in real time. This includes email open rates, top repeat opens, click rates, open to click ratios, and so on. If there's information to be extracted from data we'll return it so we're able to optimise upon our experience.
Pictured: Our email marketing statistics are extensive. Similar statistics are supplies for other Microsoft resources, such as calendars, Microsoft Planner, Tasks, and Teams. The email marketing system integrates heavily with a variety of marketing triggers. A full statistical analysis is provided for users that unsubscribed or do not engage with your material.
Autoresponder (follow-up) email statistics work in a similar manner with the exception we provide a time object (the length of an autoresponder sequence) and measure the depth of internally linked emails (a proprietary method of ours that has exploded the success of all email campaigns).
Social Media Statistics
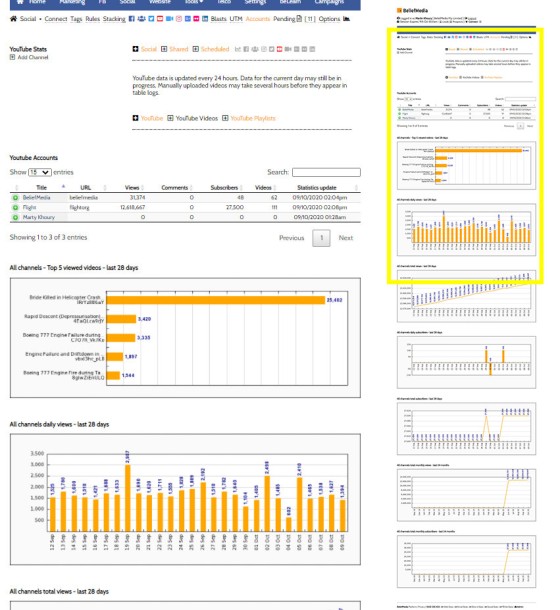
If we were to provide the graphs and tables we've created to showcase your social media efforts we'd be here forever. Social media is an important entry point to your marketing funnel, and an intrinsic component of your Gravity Framework, so it's unacceptable to simply post haphazardly and understand how results were achieved. We integrate YouTube, Wistia, Twitter, Facebook Pages and Groups, and other social networks in a way that allows you to truly measure your Facebook engagement and get a visual and visceral understanding of why various efforts performed as they did; we need to know how much traffic came from what social platform to what post, and how subsequent engagement contributed towards our aggregated results. The social media system is extensive, and the data collected supports a complete understanding of your social efforts. The social media system is introduced here.
Pictured: YouTube statistics. YouTube data is not available via YouTube by default, so we provide them for you. The YT data includes information such as daily subscribers, video views, and channel views. This data is generally replicated across all social media platforms. The primary social graphs shows how many posts were made to various platforms and the engagement derived from that action.
What is BeNet?
Data is great if it's visual - this is what most "dashboard-style" sites use these days and it makes everything look decidedly fancy (even if it doesn't mean anything). Data is pointless if a problem doesn't present itself or the data itself doesn't manufacture a solution. Our Platform has always used BeNet (our inference API, formerly known as Skynet) to identify trends, intent, and behaviour, and it does its best work when we have large amounts of data to work with. To be able to identify a problem and then fix it is truly next-generation digital marketing.
As an example of how BeNet engages with external marketing assets, the system might involved itself in your marketing by altering specific components of your website content for a single user or group of users based on predictive, inferred, or trending behaviour, or perhaps it will update a YouTube playlist based on known interest type, or maybe it will change your Facebook profile banner if it recognises the need. This isn't real AI, or course, it's more a 'cheap' machine learning algorithm that identifies patterns... and in order to work efficiently it requires lots of data.
As an example of simple BeNet 'interference', the system may recognise an uptake in First Home Buyers and set that interest type as the default or 'cold' entry page for all your new website visitors (of course it'll morph and shape as we learn more about any one user or group, but we have to start somewhere). We also want to identify herd-based trending behaviour and return that declared-oriented information by default. So, if we see a general trend in a certain type of product - perhaps in a particular state - we should be able to change content before the user lands on your website, or before they land on the 'next' page (we do this by intercepting and analysing data which includes page subject, page views, links, past interactions, read times, and so on).
Because Belief’s proprietary systems are uniquely connected (email, web, telco, downloads etc.) we tie the information and data insights together in ways that only we can provide. Our system provides the ability to track user actions on a micro level and conditionally return or course-correct the user experience based on their determined interest. This level of analysis isn’t possible with mashup of third-party tools typically pushed to businesses as a ‘solution’ (in other words, if your marketing representation has negligently pushed you into Kartra, Lead Pages, Click Funnels, and other similar services, you might as well ignore any of the benefits described on this page don't exist... because it's not an integrated system).
Conclusion
Belief includes a visual representation for everything. On the back of our evidence-based analysis we return detailed graphs to give you immediate insight into the success (or failure) of all your marketing efforts. You need to be a data-driven business.
Remember, the graphs and data shown on this page represents a very small percentage of those that are returned to your via Yabber for analysis. In each of the statistics graphs shown above you may drill further down into the data to expose more meta data associated with each resource.
The reason why we're able to take a pedestrian Facebook program normally provided to the industry and improve upon results overnight might now becoming clear. However, the enterprise-level framework we've described above is more affordable than what you've likely been exposed to in the past - You marketing defines your brand; don't let it be defined by mediocrity.
It’s time to get excited about data.


