
Some time back we introduced a basic image graph API that returned basic graphing in image format - perfect for inclusion in website articles, documents, and reports. We use the graphs in our Venus, Fact Find, and other reports, and we've found that some of our clients have seen success by way of their inclusion in their website articles. As a result we've updated the API to returns slightly more comprehensive graphing options and comparative features. This article introduces the array of graphs made available via the API, and we'll demonstrate how they're rendered on your website with our drag-and-drop Elementor block or with the use of standard WordPress shortcode.
There's a clear overlap in the information we previously provided but the API should be considered an entirely new version (while we've updated the version it maintains backwards compatibility with all existing applications).
It needs to be said that we're a digital marketing agency first and foremost. We generate far more leads and facilitate more conversions than any competing agency in the finance industry. To support that objective we provide a number of tools, website features, and services on the periphery to support that success; it's easy for this message to be lost with the amount of digital support provided on the periphery.
While the features introduce on this page are all built into our default broker website, the complimentary 'RBA plugin' made available to brokers has been updated to support the shortcode version, meaning that the core graphing service is provided to brokers at no cost.
Image graphs aren't nearly as pretty as JavaScript graphs but they're far easier to use in your pages and article, and they're obviously a better option if you choose to include them in offline reports. They're ideal for us because we can use the necessary code in our article distribution system to ensure that graphs are rendered as required when submitting articles to your website (live data, for example, will always be used when live data is required).
The Result
Introduction
The drag-and-drop Elementor block makes adding images to your website a breeze. The shortcode version, however, introduces moderate complexity, so this article might need to be referenced from time-to-time until we find a more intuitive interface.
We'll show a range of graphs with the shortcode necessary to generate the results. We'll follow on with a more detailed explanation of the available shortcode attributes.
In the case of all graphs you may include a single repayment schedule, or compare two results against each other.
Loan Balance Graph
The shortcode of [loancalc gt="lblg" a="970000" i="2.5" y="30" f="m"] returns the following:

This is the most common graph displayed for mortgages and quite simple displays the loan balance over the loan term when the minimum repayments are made. This example is for a $970,000 (a="970000") at 2.5% (i="2.5") over 30 years (y="30") with monthly repayments (f="m").
If additional repayments are introduced we'll use the shortcode of [loancalc gt="lblg" a="970000" i="2.5" y="30" f="m" e="300"]. The result:

This is the same loan balance graph as above but with an extra $300 (e="300") repayment per month (f="m").
This graph visually shows how the extra monthly repayment results in the loan being repaid sooner. The orange part of the graph displays the original loan balance without the extra repayments while the purple section display the loan balance with the extra repayments.
Extra Repayments Affect on Loan Term
The shortcode of [loancalc gt="elg" a="970000" i="2.5" y="30" f="m"] returns the following:

This graph assists in demonstrating by how much the differing regular extra repayments will reduce the loan term.
We can see from this is graph than an extra $40 per month will help reduce the loan term to 29.5 years, while double that to an $80 extra per month will help reduce the loan to 29.1 years.
Repayment by Varying Loan Terms and Interest Rates
The shortcode of [loancalc gt="rvti" a="970000"] returns the following:

This graph provides a lot of information about how the repayments of a loan will vary when there is a change in the interest rate or you change the loan term or even both. It helps you visually see by approximately how much your repayments will change.
In this specific example, the purple bar represent the repayments for a $970,000 with a 30 year loan term. If we look at the 1.5% rate, we can see the 30 year repayment (light purple bar) is approximately $3300-$3400 per month. We can also at a glance see that if the interest rate doubled to 3%, the 30 year repayment (light purple bar) will change to approximately $4000-$4100 per month.
We can also see what the affect on the size of the repayments are when the loan term is varied. If we look at the same example as above where the monthly repayment on a 1.5% rate over 30 years (light purple bar) is approximately $3300-$3400, we can see that we could potentially pay off the loan in 25 year (bluish bar above 1.5%) by increasing our monthly repayments to approximately $3900.
Principle Component of Repayment
The shortcode of [loancalc gt="plg" a="970000" i="2.5" y="30" f="m"] returns the following:

Graph demonstrating how the principle component of each monthly repayment changes over the loan term and how the later loan repayments are reducing the loan balance more rapidly.
Interest Component of Repayment
The shortcode of [loancalc gt="ilg" a="970000" i="2.5" y="30" f="m"] returns the following:

Graph demonstrating how the interest component of each monthly repayment changes over the loan term and how the the amount of interest you are paying with each loan repayment reduces as you approach the end of the loan term.
Cumulative Interest over Loan Term
The shortcode of [loancalc gt="silg" a="970000" i="2.5" y="30" f="m"] returns the following:

Graph demonstrating the amount of cumulative interest paid over the life of the loan. We can see for this example that by the time the loan has been fully paid and discharged, the interest paid was approximately $410,000.
Principle & Interest Components of Repayments
The shortcode of [loancalc gt="pilg" a="970000" i="2.5" y="30" f="m"] returns the following:

This graph shows together in one graph way how the amount of principle and interest paid change with each repayment. The red line representing the amount of interest paid and the green the amount of principle paid. We can see from the graph that it will take a little over 2 years before your monthly repayments are paying more principle off your loan than interest.
An alternate means of showing the same information may be returned by way of the shortcode of [loancalc gt="pisbg" a="970000" i="2.5" y="30" f="m"]. The result:

This graph shows in clearer way the amount of principle and interest paid with each repayment. The red representing the amount of interest paid and the green the amount of principle paid. The top of the graph shows the total monthly repayment which in this specific example is approximately $3900.
Cumulative Interest over Varying Loan Terms
The shortcode of [loancalc gt="sivt" a="970000" i="2.5" f="m"] returns the following:

Graph showing the cumulative amount of interest that will be paid on a loan based on the term of the loan.
Loan Balance - Comparing Two Loans
The shortcode of [loancalc gt="clblg" a="970000" i="2.5" y="30" f="m" ca="900000" ci="2.0" cy="30"] returns the following:

The loan balance graphs of two different loans superimposed, allowing you to compare them directly to each other.
You can specify a different amount, interest and term for each loan.
Cumulative Interest - Compare Two Loans
The shortcode of [loancalc gt="csilg" a="970000" i="2.5" y="30" f="m" ca="900000" ci="2.0" cy="30"] returns the following:

Allows you to compare the cumulative interest of two different loans. You can specify a different amount, interest and term for each loan.
Interest Component of Repayment - Compare Two Loans
The shortcode of [loancalc gt="cilg" a="970000" i="2.5" y="30" f="m" ca="900000" ci="2.0" cy="30"] returns the following:

Allows you to compare the repayment interest component of two different loans. You can specify a different amount, interest and term for each loan.
Cumulative Interest over Varying Loan Terms - Compare Two Loans
The shortcode of [loancalc gt="csivt" a="970000" i="2.5" y="30" f="m" ca="970000" ci="1.8"] returns the following:

Allows you to compare the cumulative amount of interest that will be paid between two different loans based on the term of the loan. The blue line shows the amount of interest saved between loan1 and loan 2.
This specific example shows how much total interest is saved over the different loan terms when the loan 2 amount is kept at $970,000 (same as loan 1) and the loan 2 interest rate is changed from 2.5% to 1.8%.
Loan Balance - Compare two loan - Loan 2 repayments kept at the same amount as loan 1.
The shortcode of [loancalc gt="rclblg" a="970000" i="2.5" y="30" f="m" ci="1.8"] returns the following:

Shows the impact on a loan balance and loan term when the repayments of loan 2 are kept at the same amount as loan 1.
This specific example shows the impact on the loan Balance when the interest rate is changed from 2.5% (loan 1) to 1.8% (loan 2). The minimum monthly repayments on loan 1 ($970,000 at 2.5% over 30 years) is $3,832.68. If this same monthly repayment amount is kept for loan 2 ($970,000 at 1.8% over 30 years), the loan can be expected to be paid off approximately 3 years and 5 months sooner.
Cumulative Interest - Loan 2 repayments kept at the same amount as loan 1
The shortcode of [loancalc gt="rcsilg" a="970000" i="2.5" y="30" f="m" ci="1.8"] returns the following:

Shows the impact on the amount of cumulative interest paid when the repayments of loan 2 are kept at the same amount as loan 1.
This specific example shows the impact on the cumulative interest paid when the interest rate is changed from 2.5% (loan 1) to 1.8% (loan 2). The minimum monthly repayments on loan 1 ($970,000 at 2.5% over 30 years) is $3,832.68. If this same monthly repayment amount is kept for loan 2 ($970,000 at 1.8% over 30 years), the amount of interest saved is approximately $158,000.
Interest Component of Repayment - Loan 2 repayments kept at the same amount as loan 1
The shortcode of [loancalc gt="rcilg" a="970000" i="2.5" y="30" f="m" ci="1.8"] returns the following:

Shows the impact on the interest component of the repayment when the repayments of loan 2 are kept at the same amount as loan 1.
This specific example shows the impact on the interest component of the monthly repayment when the interest rate is changed from 2.5% (loan 1) to 1.8% (loan 2). The minimum monthly repayments on loan 1 ($970,000 at 2.5% over 30 years) is $3,832.68. If this same monthly repayment amount is kept for loan 2 ($970,000 at 1.8% over 30 years), the loan can be expected to be paid off approximately 3 years and 5 months sooner and you can see displayed by how much the interest component of loan 2 is less than loan 1 over the term of the loan.
Interest Rate Versus Comparison Rate
The shortcode of [loancalc gt="ivcblg"] returns the following:
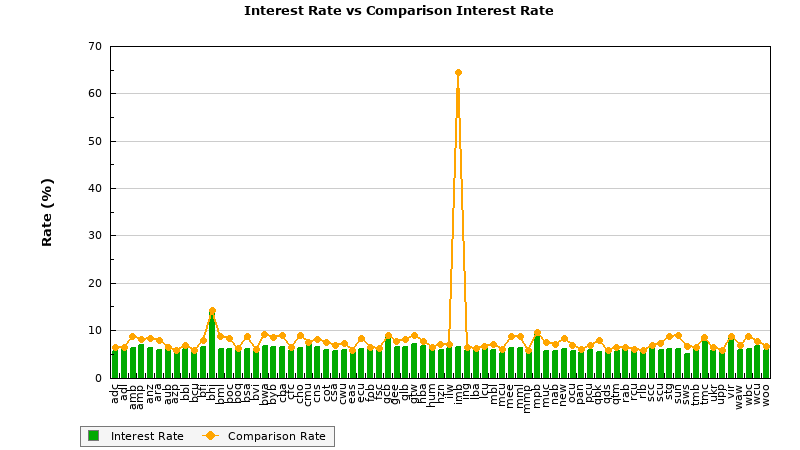
The Interest and Comparison graph is intended to show the disparity between the advertised and actual rate offered by your lenders. By default we'll source the rates associated with products on your panel. The JavaScript version of this graph is available in our free and clients plugins.
RBA Cash Rate, Inflation, and CPI
The shortcode of [loancalc gt="rbablg"] returns the following:
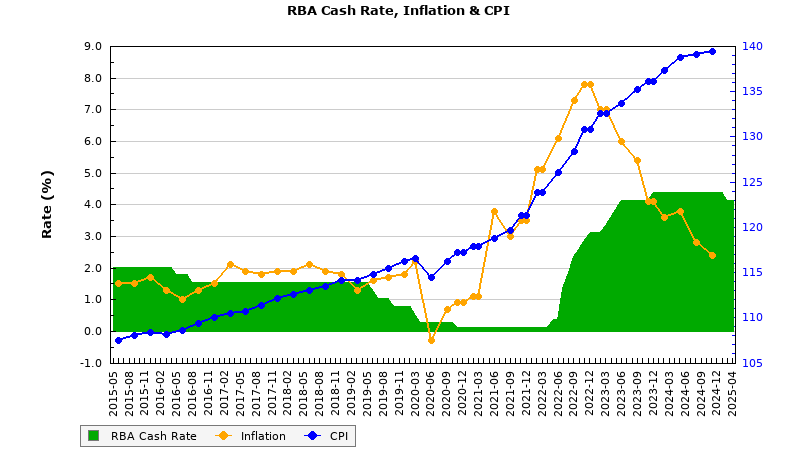
The 'interactive' JavaScript version of this graph is available in our complimentary RBA plugin. A large number of other graphs are available that display different types of Economic indicator information.
Mortgage Graph Elementor Block
The Elementor Block is a simple way of rendering the graphs on a page. You simply drag the 'Mortgage Graphs' block onto a page, fill out the required values, and save. As the only example of such a feature in the country, it's a brilliant way of adding visual and visceral support of your in-page repayment examples.

Pictured: Belief's Elementor plugin makes adding graphs easy. Once in position fields are presented for Loan 1 and Loan 2 (for comparative calculations). In the case of standard posts you'll still probably use shortcodes, but the Elementor option may be used everywhere else. Creating a graph takes no more than a few seconds.

Pictured: The graph is selected from a number of options. The same values may be applied to multiple graphs simply by copying each graph and assigning a new graph type.
The free version of this plugin doesn't include the Elementor Widget simply because the builder isn't necessarily used by brokers.
The Graph Image
For fixed graphs, or those that don't change, we save them into a 'graphs' folder in the plugin's image directory. For those graphs that change over time, such as the RBA Graph and Comparison Graph, we store the image in the same location but it only remains valid for two weeks, meaning that fresh data will always be applied when necessary.
By default we don't import the image into WordPress' image library simply because it'll fill it up with images that'll pollute your library with images you'll rarely use. However, if you expect to use a 'static' image over and over you may use the attribute of import="yes" in your shortcode and the image will be stored in your library rather than the default directory... although this forces a static image even if data updates should be applied.
Shortcode Attributes
The graphs support any rate, period, additional repayments, and frequency. Available shortcode attributes are as follows:
gt (gt=plg)
a (a=400000)
i (i=4)
y (y=20)
f (f=m)
e (e=100)
fp (fp=23/02/2020)
ca (ca=400000)
ci (ci=4)
cy (cy=20)
cf (cf=m)
Conclusion
Graphs in your marketing material and on your website are essential, and the feature we've just introduced makes it easy. Clients will see the changes in V0.8.3.2 of the Yabber plugin, and the free RBA plugin will see updates in V0.3.
Keep in mind all our plugins support JavsScript versions of graphs, such as the comparison rate graph, various RBA Graphs, and standard free-form graphs. The same plugins providing the functionality also provide current cash rate data, exchange rate data, and other financial indicators.
Once again, the former version of the Loancalc API will continue to function, and backwards compatibility applies to all systems that currently use the former version. The API itself returns large amounts of data based on the supplied attributes, so if you do require deeper access to data in order to support your own applications the information is supplied by the RESTful service.


