There may be occasions in the development of your website content that you'll be required to include historical cash-rate data into your articles, or perhaps into a PDF for publication. Certainly, it's expected that any finance broker website will include such vital and rudimentary information on their website for their online audience. Thankfully, we have an API that returns always up-to-date source of cash rate information which is built into our broker website by default.
Built from data sourced from the RBA, the API returns the cash rate for every single day, just RBA Tuesday, or those days where the Board introduced a change. The primary purpose of the website tool, however, is to return just an RBA cash rate graph or the single current cash rate value (currently 4.10%).
The API is one of about one-hundred sources of Yabber  data we're progressively making available to clients. To make the data more useful we're usually including relevant graphing features so you're able to quickly include the information on your website or elsewhere.
The most relevant source of interest data is our bank feed APIs that aggregate various bank products and it should be referenced for consumer-facing relevance (the API returns advertised rates and features, and it's the same API we will use to power your complimentary comparison website).
The API itself returns basic cash rate, rate change, and various interbank cash market transaction data. The full RESTful API is documented within Yabber  or made available on request. The data is returned in multiple formats making it easy to use Google charts or our own JavaScript graphing library.
This article introduces simple website usage.
The Result
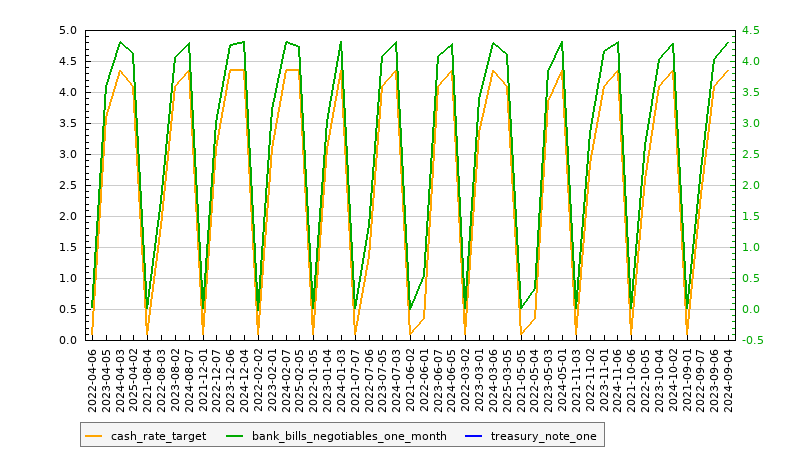
A basic historical RBA cash rate graph is returned with the shortcode of [cashrate_graph]. The result:
Update: This graph was replaced with a JavaScript graph. The shortcode attributes remain the same, while the shortcode name has changed. The graph is also available in our free mortgage broker plugin.
By default the graph returns two years of monthly data. Available shortcode attributes are as follows:
frequency
The frequency of results. Available attributes are
day,month, andyear. The month value is returned by default and is always most appropriate.
points
The number of data
pointsto return. Shortcode defaults to 24. In the above example we've returned 48pointswith the following shortcode:[cashrate_graph points="48"].
end
To limit the results between certain dates you may use the
endandstartattributes. Accepts any numerical time group, such as 202007 (July, 2020). If supplying just anenddate we'll return the preceding 24 datapointsunless defined.
start
To limit the results between certain dates you may use the
endandstartattributes. Thestartattribute will usually require theendorpointsattribute to limit results (supplying just astartdate will return 24 datapointsunless defined). The shortcode accepts any numerical time group, such as202105(May, 2021).
fields
A number of lines representing various values may be returned to the graph but they're usually not required. In the above example we've returned the
bank_bills_negotiables_one_monthdata and the emptytreasury_note_one(or Treasury Note One Month data) with the shortcode of[cashrate_graph points="48" fields="cash_rate_target, bank_bills_negotiables_one_month, treasury_note_one"]. The Treasury data isn't depicted in the graph because of empty values. It's usually easier to just use the default values.
show
The
showvalue is eitherall(default),tuesday, orchange. At times the Board may convene outside of the typical 'RBA Tuesday' schedule and the change attribute will return these value. Thetuesdayvalue is the default and will return just RBA Tuesday results. Theallattribute will show all changes to the rate. Note that thechangeattribute will only show occurrences where the rate was altered (and exclude all results where the rate remained unchanged). It gets a little complicated so we recommend you simply use the default values.
Current Cash Rate Value
On our default client website we have a small section in the footer that shows the current cash rate alongside the current currency exchange rate.
The current cash rate value is returned with the shortcode of [cashrate]%%cashrate%%[/cashrate]. The result: 4.10% (bold text is ours and not default behaviour). The placeholder is used because you may include additional text alongside the returned cash rate within a tooltip. For example, to return the following string with the highlighted cash rate of 4.10% we used the shortcode of [cashrate modal="This is an example tooltip. Current cashrate is %%cashrate%%."]highlighted cash rate of %%cashrate%%[/cashrate].
Conclusion
The features we've just described are just a couple of finance-specific tools to render financial data in various ways on your website. The cash rate alone - while a vital website resource - isn't necessary used by clients to investigate their banking needs (nor is the APRA supplied data or graph). Instead, we have various tools available to return real-time banking information and rates directly to your website, and it's this tool that'll add serious value to your online presence and draw visitors back to your website.
We see a lot of 'agencies' claim to provide broker websites, or 'smarter' websites, and we're not particularly convinced they have any idea what this means. Your website should be a trove of feature-rich resources and the RBA data we've just introduced simply contributes to your perceived expertise and authoritativeness. You absolutely cannot have an effective marketing funnel if your digital presence doesn't support your ambitious claims of "better rates, service, and structure" if your digital footprint provides the opposite impression - you will alienate your online audience of any kind (Facebook and Google paid traffic, for example) if your arsenal of digital resources don't elevate your service above those of your competition.


