The level of statistical integration availed to those that use Yabber (and our broker website) was always industry leading. However, with over 100 modules that feed statistical data into our conditional engine, the system started to become fragmented, and with a massive focus on 'behavioural analytics', we determined an update was necessary. System growth led us to build a ground-up 'AI-first' statistical engine that was built on the back of several billion data points. We took an axe to the previous system and developed what we call Xena. The massive architectural and AI-supported update (dating back to 2024) finally unifies all Yabber modules into a single source, and more seamlessly integrates shor.tt, email marketing (Nexus), CRM, Matrix Insights, property listings, lender data, social media, VoiP logs, CRM actions, landing pages, campaigns, triggers, and Microsoft tools, and we've finally migrated heatmap, scroll, and screen recording functionality that was once the domain of those engaged in paid promotion. The latter functionality alone would normally cost hundreds per month, but it's now part of the default stats engine.
Migration into Your Website: The updated Xena module also signifies the initial migration of Yabber into a format that is far more suited to a user-friendly dashboard, and at the time of writing there's every expectation that your own website will shortly provide dashboard functions for statistics, email marketing, SMS marketing, and other big-ticket tools - thus negating the need to log into Yabber.
Basic Statistics API: Statistical data is made available in Yabber as it always has been, and because of the need for businesses to analyse their data in different ways, we've created a unified and very powerful API, and to make life a little easier. For those that don't like APIs, we've created simplified endpoints for more common and basic JSON or CSV requests that requires zero technical knowledge.
Image Graph API: Previous statistics were rendered on images as 'image graphs', but they were static in nature and unable to accurately represent the massive data options returned via our API. Ideal for printing in reports, on website articles, and in shared content - which is where they will continue to be used - the image format slowly became obsolete for use in Yabber. We continue to maintain a full featured 'Image Graph API that returns mortgage results to your website, and the image format will continue to be used because of the ease at which they can be multipurposed. However, we'll likely add an alternate JavaScript option when we update our full suite of mortgage calculators.
Chart Migration: While the migration of data into Xena is nearing complete, the creation of the charts that represent the data is still an ongoing effort. Migration is around 75% complete, so we've kept older data active, and as the new representation is created we'll simply redirect you to the new pages. Expect VoIP, Email Marketing, SMS, and Landing Page statistics to be available shortly.
If your read no further, understand that we provide statistical insights that exceed the capability of any competing solution by a magnitude that makes other options meaningless. We provide the data necessary to understand the pulse and heartbeat of your operation to a point where growth, leads, and bottlenecks are easily identified. Unlike any other solution, Xena unifies all website, marketing, and CRM data into a single, actionable, and intelligent source.
The Landing Page Adventus Module
OUr updated landing page module is now known as Adventus - a complete turnkey and ready-to-go module with generic (but editable) compliant and high-performing landing pages that enable complete agility in your advertising efforts. The Adventus module is the managed landing component in that they are an always-existing and frequently updated starting point. Another module allows the quick creation with drag-and-drop tools to easily build full and complete pages with conditional redirects. There shouldn't be a need for a business to 'create' landing pages when the format is so consistent, and when performance of various structures is known.
We haven't run a landing page in over 10 years that didn't include heat and scroll data, and these heat elements unquestionably essential in measuring the on-page interactions and associated success of each page. We discuss heatmaps shortly, but you'll find more information in our FAQs.
The latest interaction of Adventus is introduced in an article titled "The Landing Page Module is Updated to Adventus".
Xena and SEO
We've always taken great pride in the results achieved via our SEOupport, with dozens of brokers seeing daily website leads, and a handful attracting triple-digit leads every month. We apply SEO to your website by default, but those that are investing effort into the endeavour can build out an industry-leading and entirely customised SEO presence .
There's a ton of information on SEO in our FAQs, but you can read about the most recent iteration of our SEO Module in an article titled How Our Marketing System Manages Your SEO To Attract Free Organic Traffic.
If anybody tells you that their SEO systems are more effective than ours, they're lying to you.
Xena and the Website Framework
The values of our statistical engine is multi-faceted, but the single most valuable outcome is the extremely granular statistics making it effortless to identify digital performance. Our comprehensive website framework includes a large number of post types (or modules), and each serves a specific purpose with varying outcome objectives, and we measure the performance of each of these modules and the grouped or individual pages within these modules - something generic analytics tools simply cannot do. In other words, the statistics are in no way generic and instead tailored specifically to your suite of website tools.
Our website is integrated, so we don't use dogy forms, upload tools, download managers, or anything else that is normally a fragmented and untrackable feature. Instead, everything is managed via a unified architecture that ensures each insight is derived from a comprehensive view of operations, allowing businesses to understand not just isolated events, but the systemic dynamics that govern performance across their entire digital ecosystem.
The most recent version of our website framework is detailed in an article titled "Broker Website Framework, Version 2025XX".
We rant on all the time about the importance of brokers having a sound website framework, and the message is often ignored based on the completely ineffectual nature of aggregator websites or those shonky and underperforming subscription sites charged by the month. Certainly, our website is the only funnel-centric product in the industry - an absolute necessity if you engage in paid promotion, and our site is the only platform to deliver granular statistics - something we're particularly proud of, and something that supports our exceptional results.
Statistics on this Page: The graphs shown on this page are examples only, and they exclude SMS, Email, Campaign, Landing Page, and other examples. The data was sourced from a number of users in order to ensure we didn't expose the performance or any individual broker.
The User Temperature and Singularity
Data science and probability can be extremely accurate when fed with meaningful data, and we've developed a highly accurate algorithm that is able to reliably predict growth, conversations, and campaign effectiveness. The aggregated mashup of weighted input-output variables builds a structured profile of what time-weighted input actions manufactures a conversion, and more importantly, the system can instruct you on specific actions necessary to 'build' and achieve defined volume targets.
What we call the Singularity is a temperature that typically results as a conversion or some other contact type. Each known digital contact carries a temperature that signals contact or conversion intent, with the figure determined by the amalgamation of all interactions of all types - from email counts to website page views - and it is this single figure that we seek to improve (or decrease) over time. You may optionally choose to share deidentified statistics in order to measure your score measured against all other Yabber users.
The Singularity is measured in two ways: a user temperature, and a temperature assigned to all users. This single figure is extremely accurate in predicting precisely what actions are required in order to convert a funnel participant, and it reliably builds a likely volume trajectory based on funnel activity and scheduled tasks.
Singularity data is sourced from Xena - the most complete, comprehensive, and powerful statistical engine in the mortgage industry. This article simply shows some of the graphs (built on the back of Xena data) that contributes towards the resolved Singularity figure, and it starts to expose the significant value of the backend management that supports the industry's most powerful website and broader marketing experience.
Data in isolation is kind of pointless; as data-driven businesses, we're required to aggregate data sources in order to manufacture actionable intelligence - something general statistics just can't do.
The singularity is discussed in an article titled "The Xena Singularity Re Predictive Mortgage Growth", and we'll publish it when the data makes its way into Yabber.
Nexus Email Marketing: At the tie of writing this article, we're days aware from releasing our updated email marketing module, now called "Nexus" (married to the SMS module with shared Microsoft Contact Lists). The system now uses Microsoft contacts and Categories exclusively - a first in the email world. Many brokers have told us that the statistics returned from their existing system didn't integrate with their website (something ours has always done), and that the statistics were truncated to the 'nearest million' for larger businesses. Our module is heavily indexed with aggregation tables, meaning that absolute accuracy is maintained for lightning-speed reporting. Review examples of the email marketing statistics in an article titled The Email Marketing Module is Now Nexus.
A Website Framework That Converts
"My Website Doesn't Convert" - We hear this all the time. The reason your website doesn't feed your conversion funnel is because it isn't supported by the tools necessary to convert, the facilities on every page to garnish user attention and deliver conditional relevance, and it is so limited in scope that there's simply nowhere for users to go in order to find solutions to the problems your website should be designed to provide.
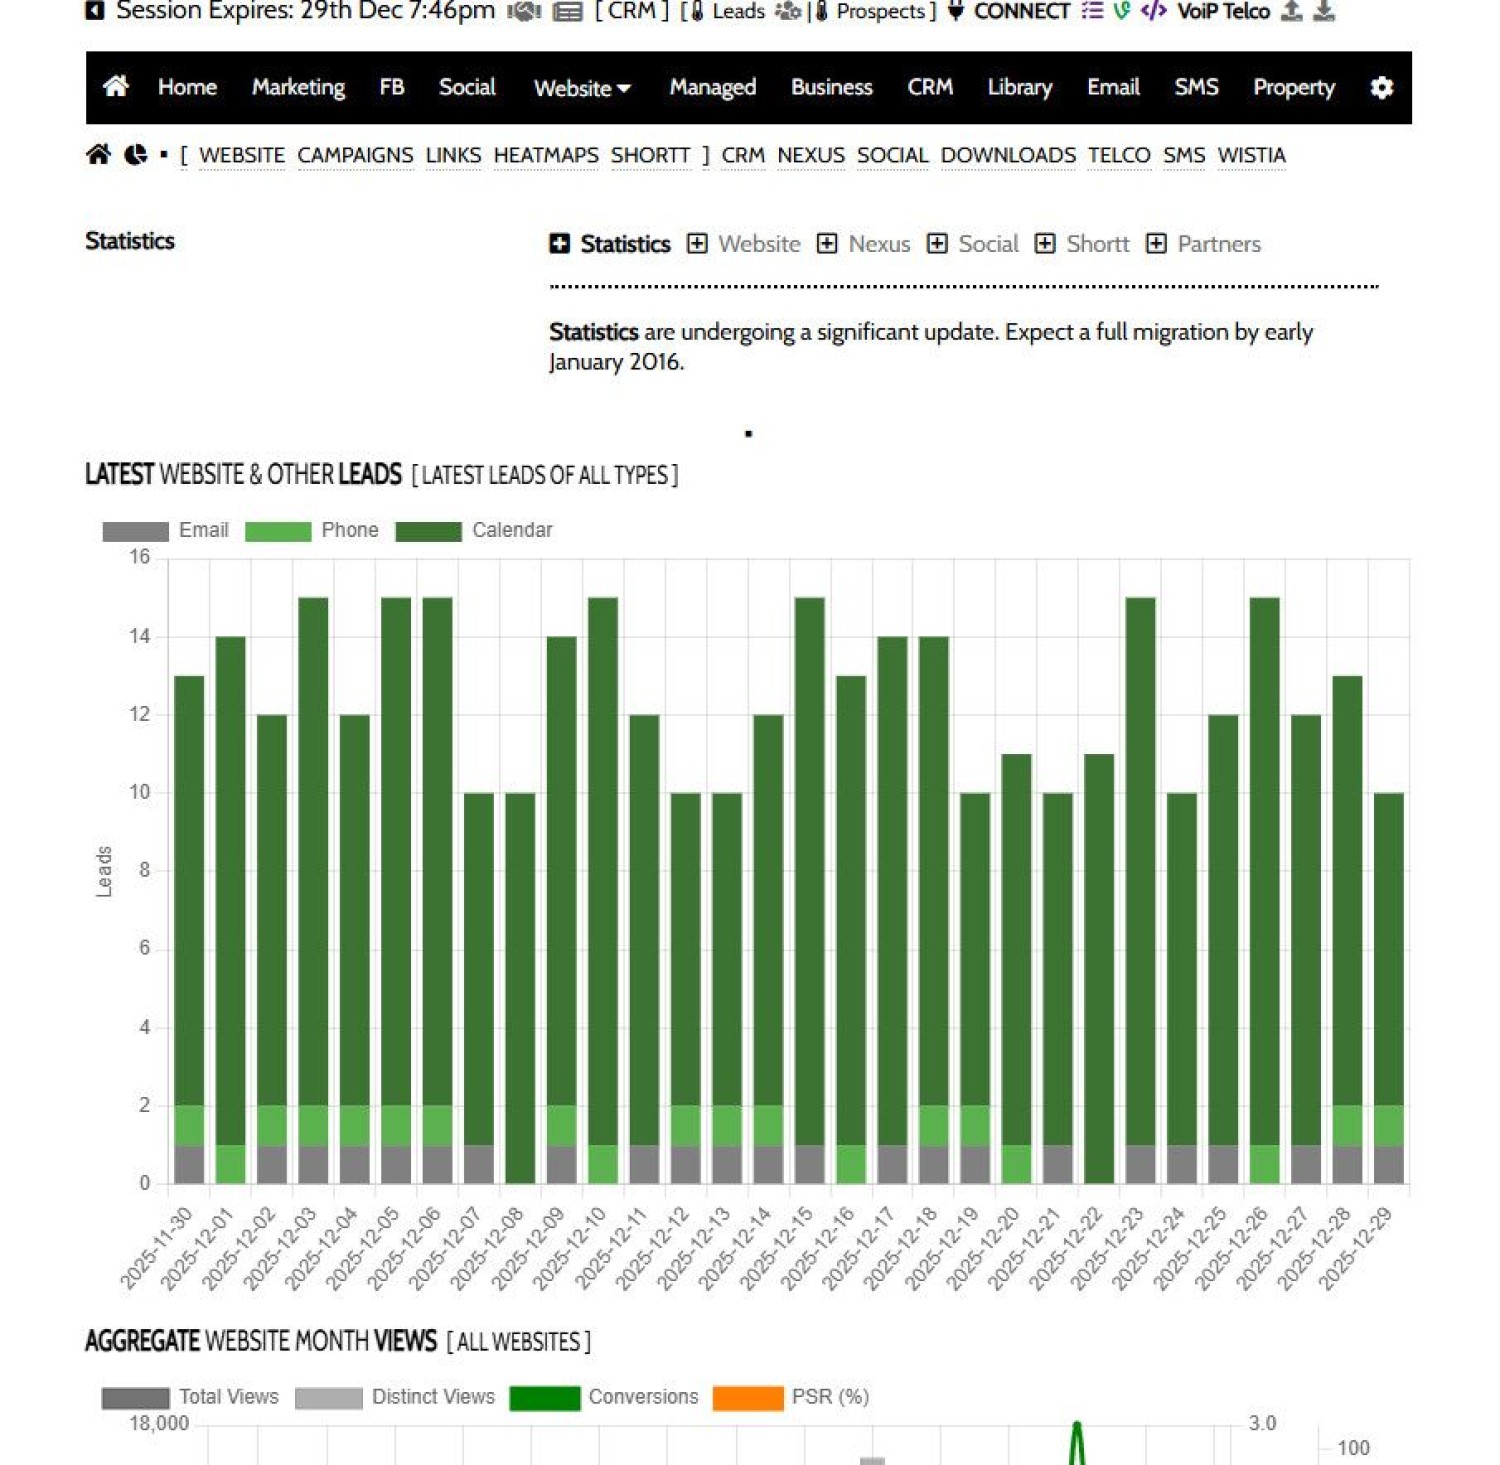
Pictured: This is how a group returned 200m in monthly volume for less than 7k. 364 paid leads. Around 35% of their monthly lead expectation. Around $17 per SMS-verified lead. A little high, but verification will do that (it also reduces lead quality by about 20%). Around 243 converted clients based on results measured to the 14th December. Expected monthly return is over $200m. About 77% of leads visited the group website, and about the same number visited more than 5 pages. Half of that group visited the site again to review bookmarked or other pages. Digital done right gets results. You shouldn't expect to break a speed record in your Corolla, and you shouldn't expect good online results with a poor customer journey. Leads are stacked based on email, phone, calendar, and contact.
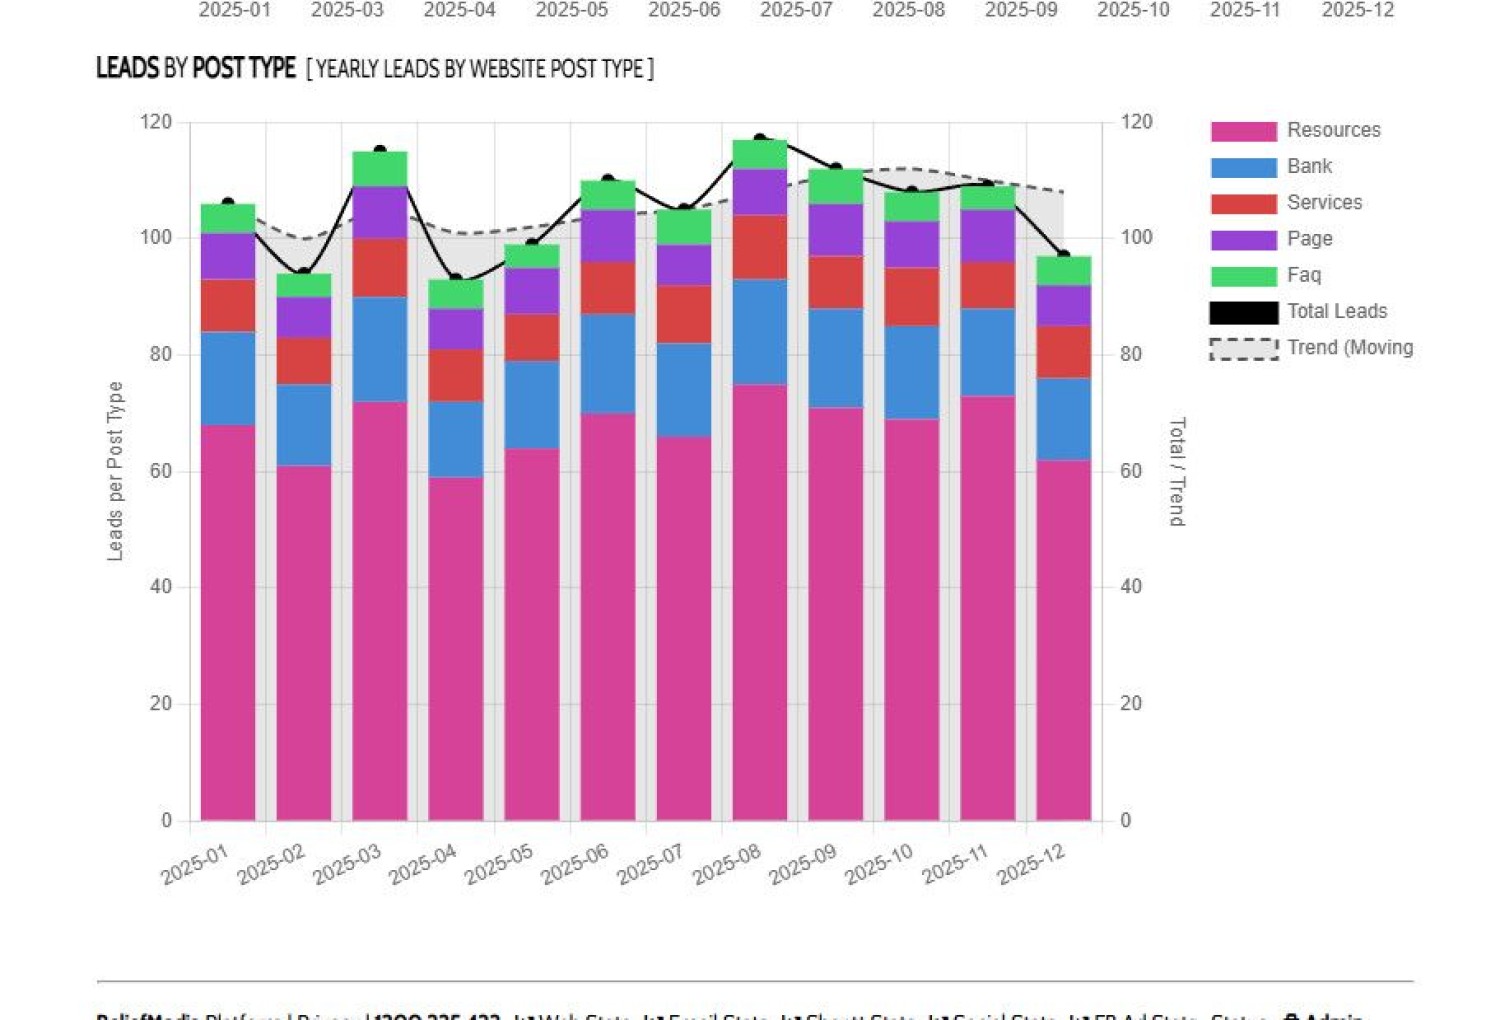
Pictured: Leads are identified by the form submitted, the page, the geography, and about 30 other primary data points. More important, we need to know what modules on our website are performing better than others, and with around 20 website modules, statistics should identify those areas where we should focus our efforts. In a broad sense, we want to know what modules, pages, and geography is performing better than others. Generic statistics simply don't provide this necessary information.
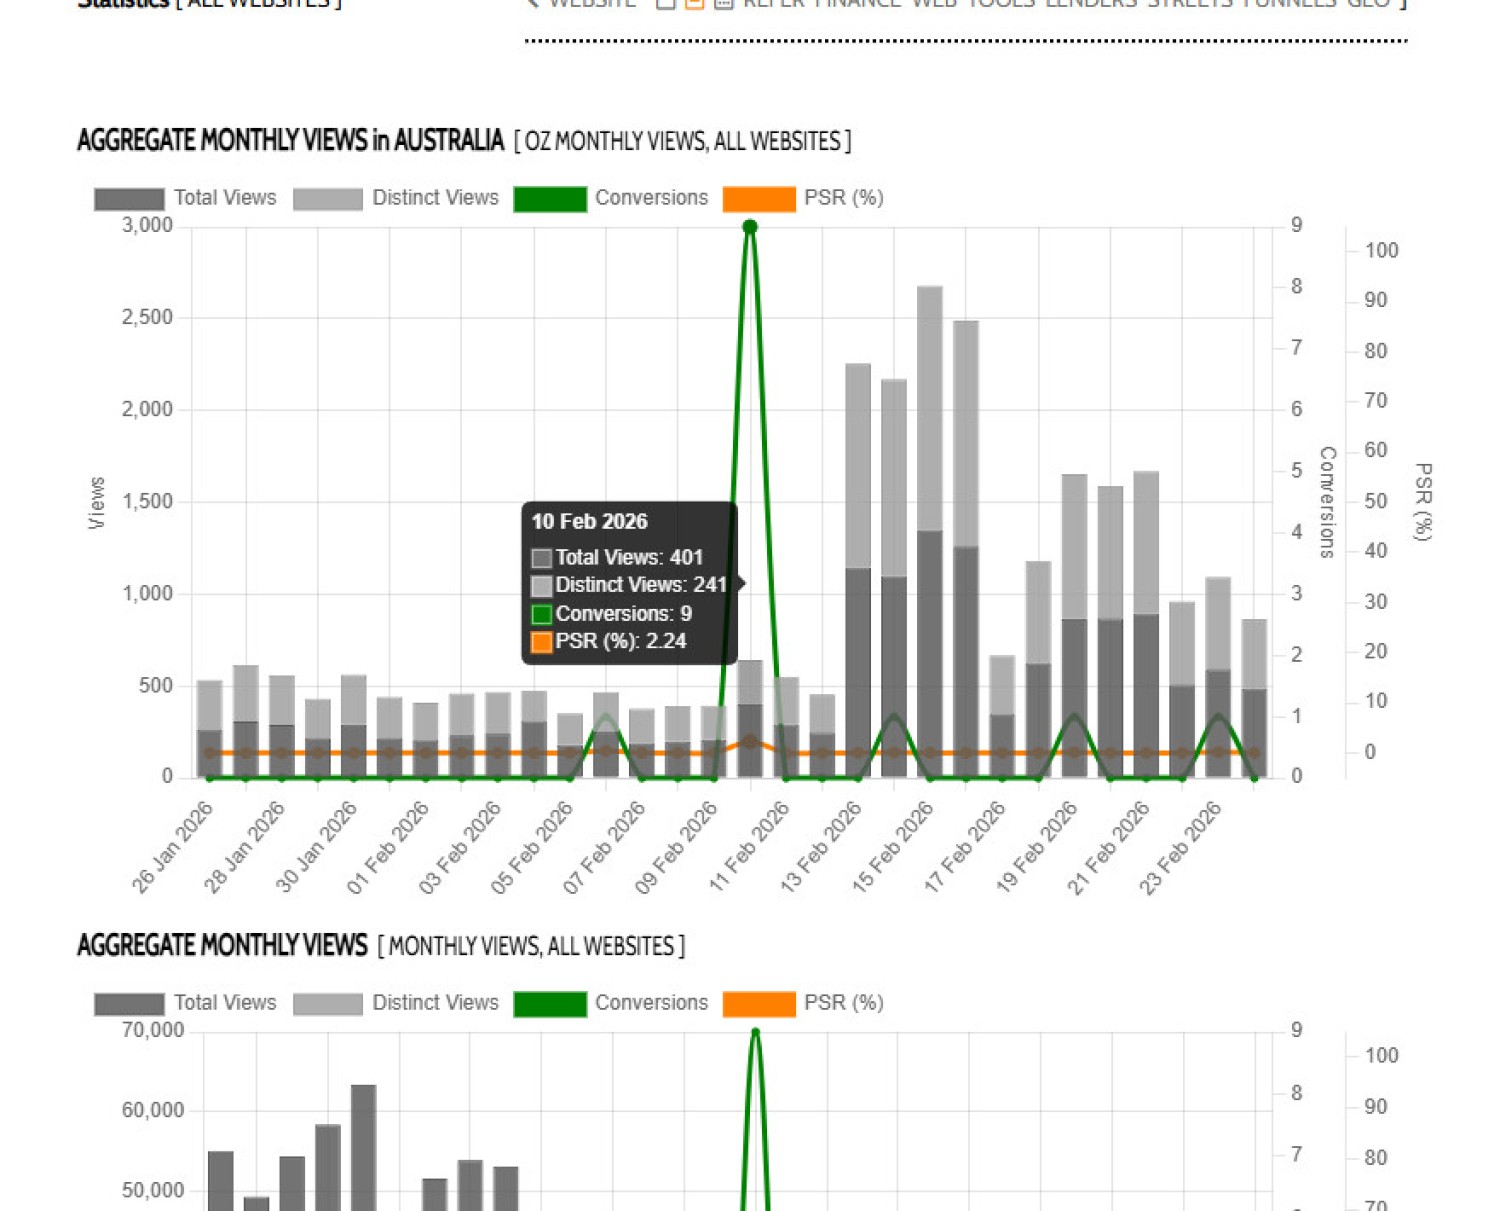
Pictured: What makes this graph interesting is that it's exactly 30 days of a broker with a new site. With a little promotion, he's already seen a daily lead average, with one day picking up 9 leads off a social media campaign (resulting in a PSR of 2.3%). General 'aggregated' stats are the bread-and-butter of your website information, and we return them for various default time periods. It's important to measure real conversions (not 'naked' leads) on these graphs. The pictured user clearly doesn't run Facebook ads (leads coloured blue in the stack).
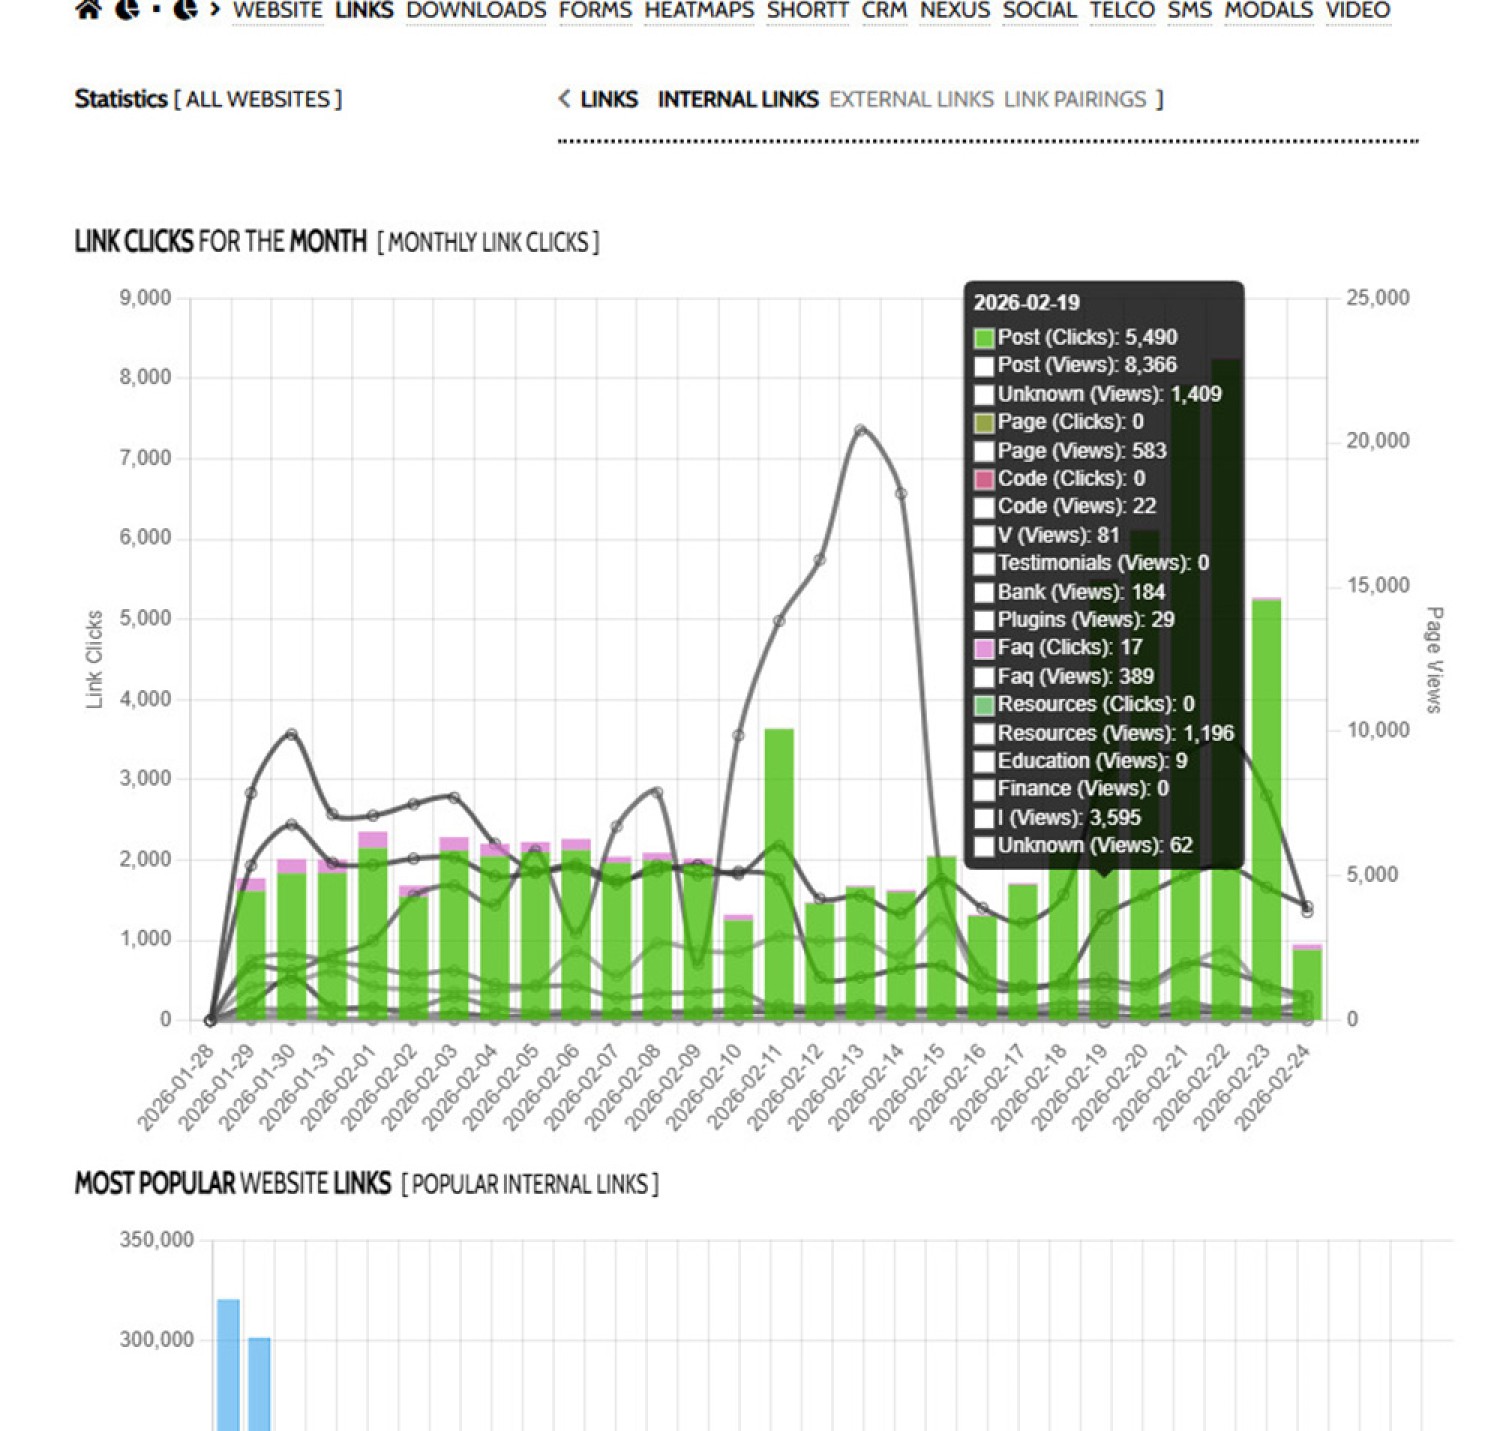
Pictured: Link clicks (both external and internal) are key performance metrics that need to be tracked. Additionally, we assess each click for the triggers that fire off other funnel-focused actions.
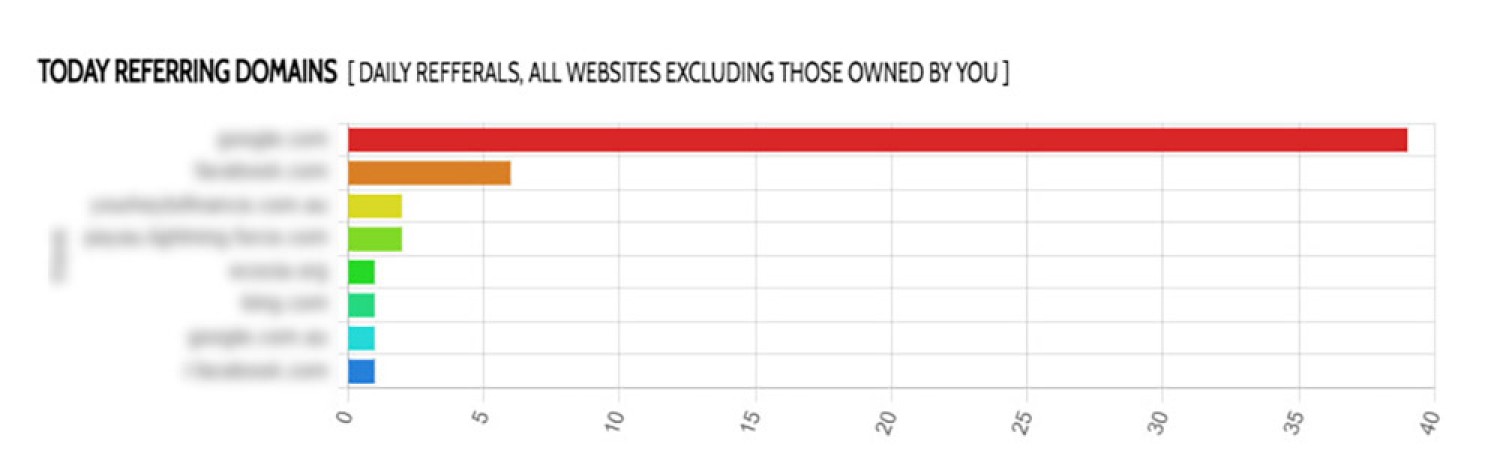
Pictured: Where is your traffic coming from? A number of graphs show referrers, search referrals, and teh most popular referred pages by filtered criteria.
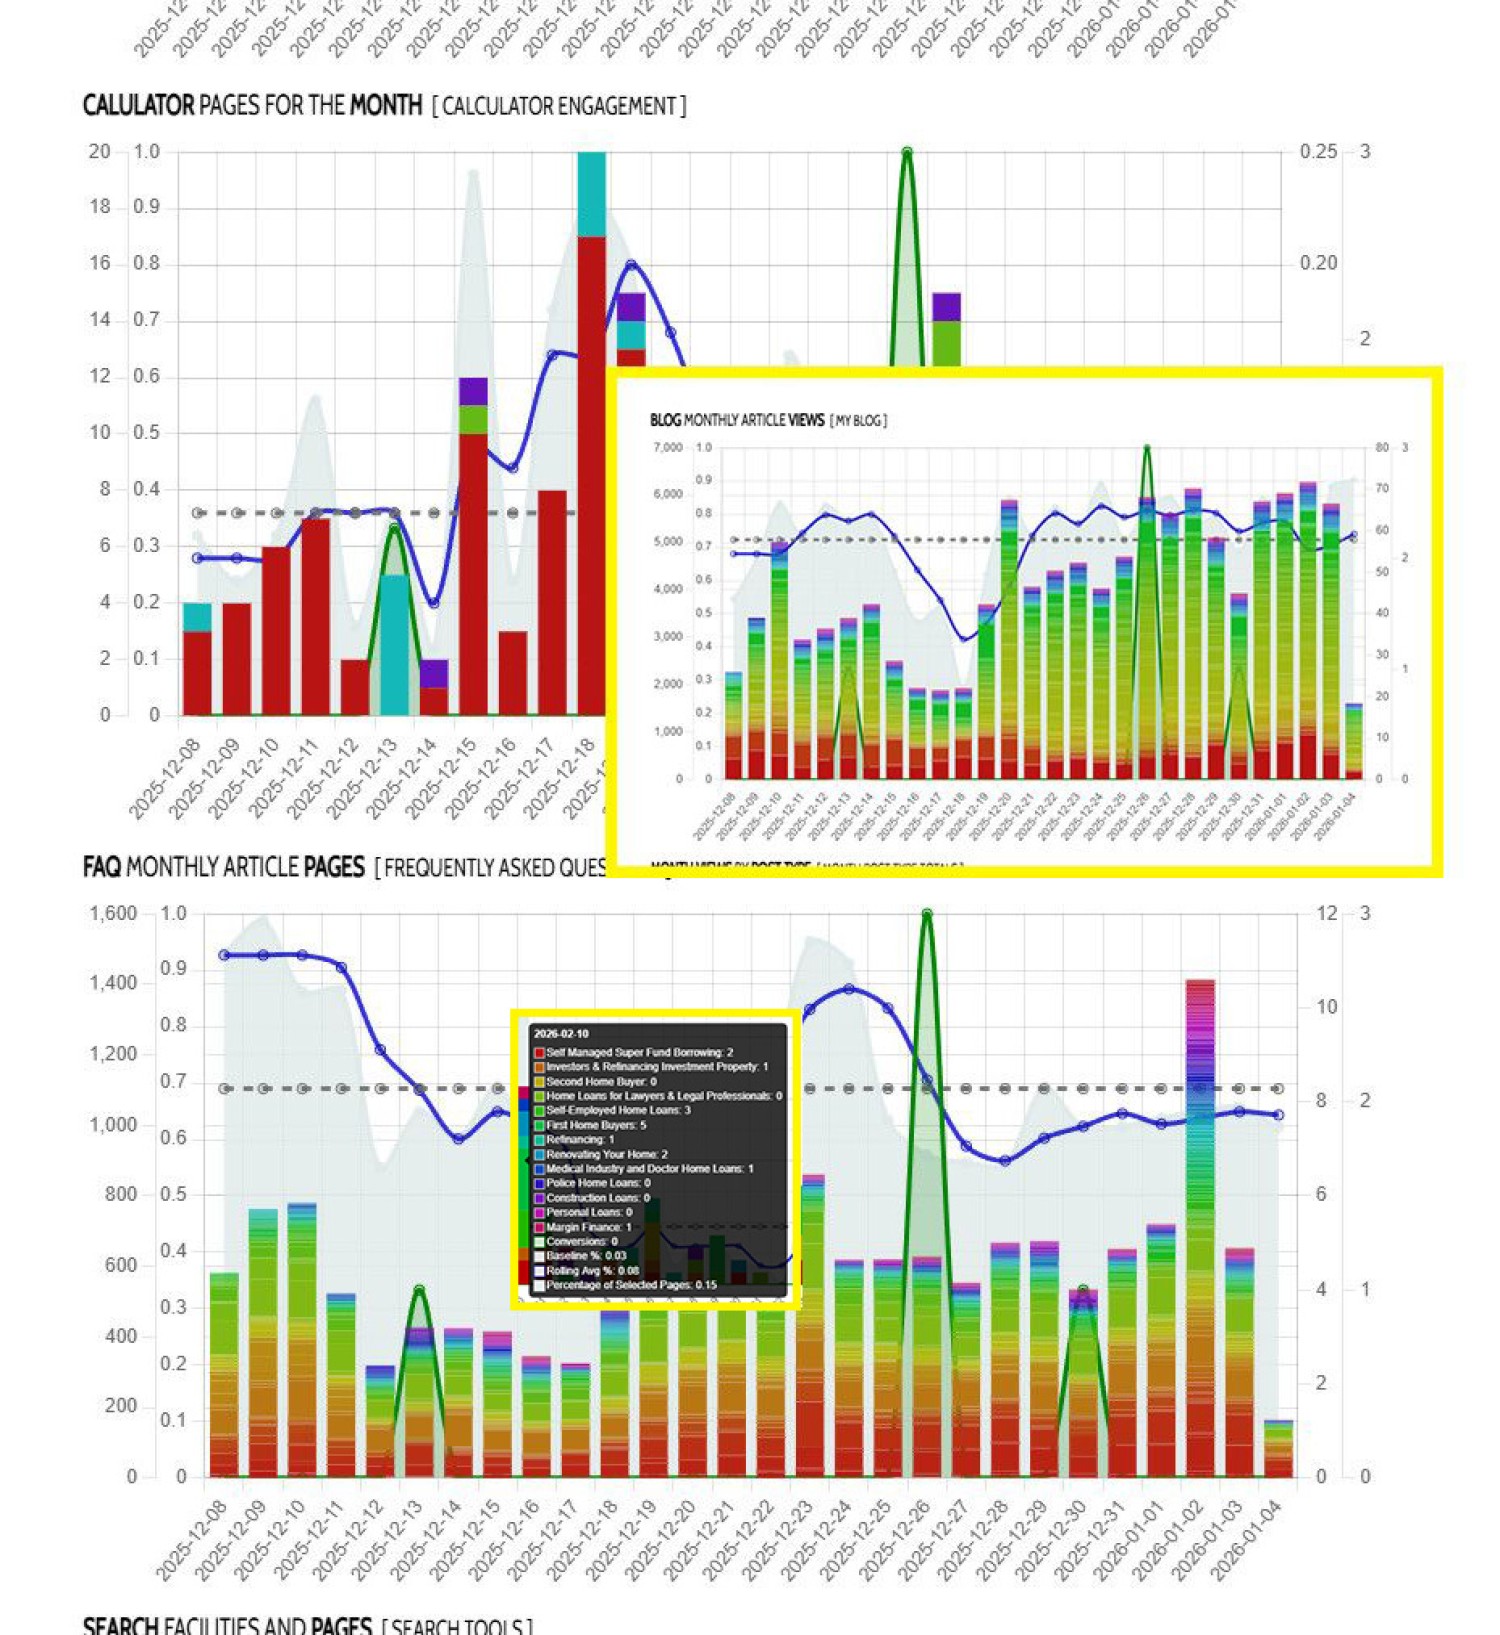
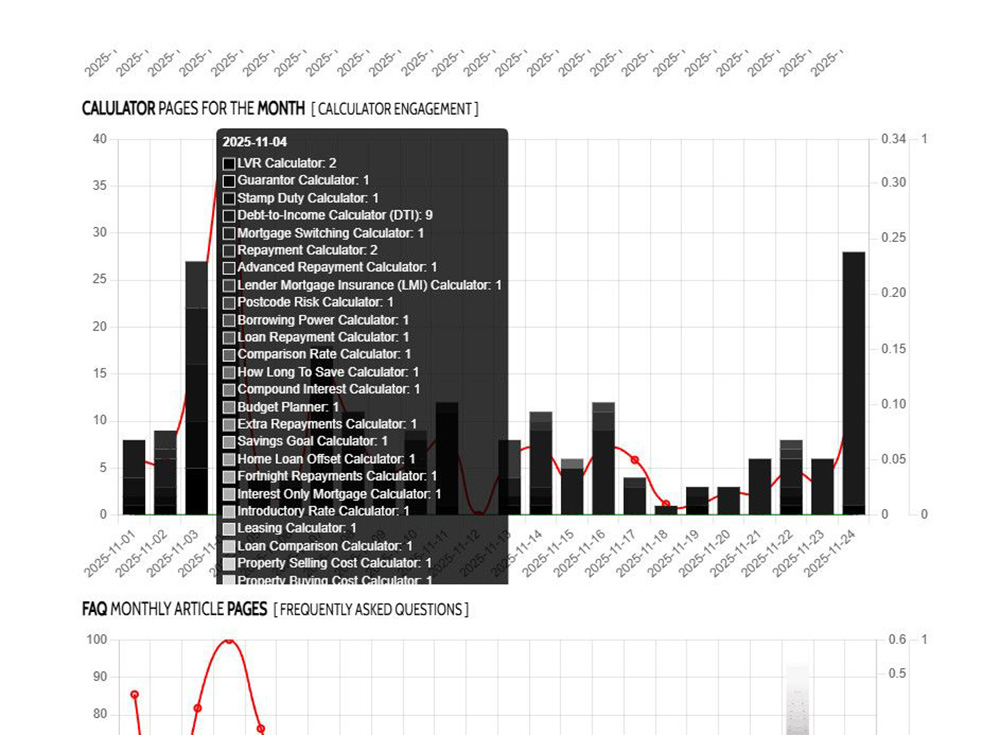
Pictured: Most modules are measured independently of others, so you're able to review the success of each module to the page level (the colours of the bar chart will indicate viewed pages with data). Pictured is the calculator page, FAQ module, and blog. Importantly, conversions are also shown measured again a 3-day trend. This calculator screenshot  (taken on one of the reporting graphs, so presented a little differently) is very revealing. What does it tell us? You need to have calculators on your site to satisfy broad E+AT expectations, but they're only something you need to have, not something that'll actually be used. For a lot of brokers, 10-20 page views a day on just calculator pages might be a lot, but for our guys - while the pages should be design to convert (a whole other discussion), and should have purpose - they represent around 0.05% of all daily visits.
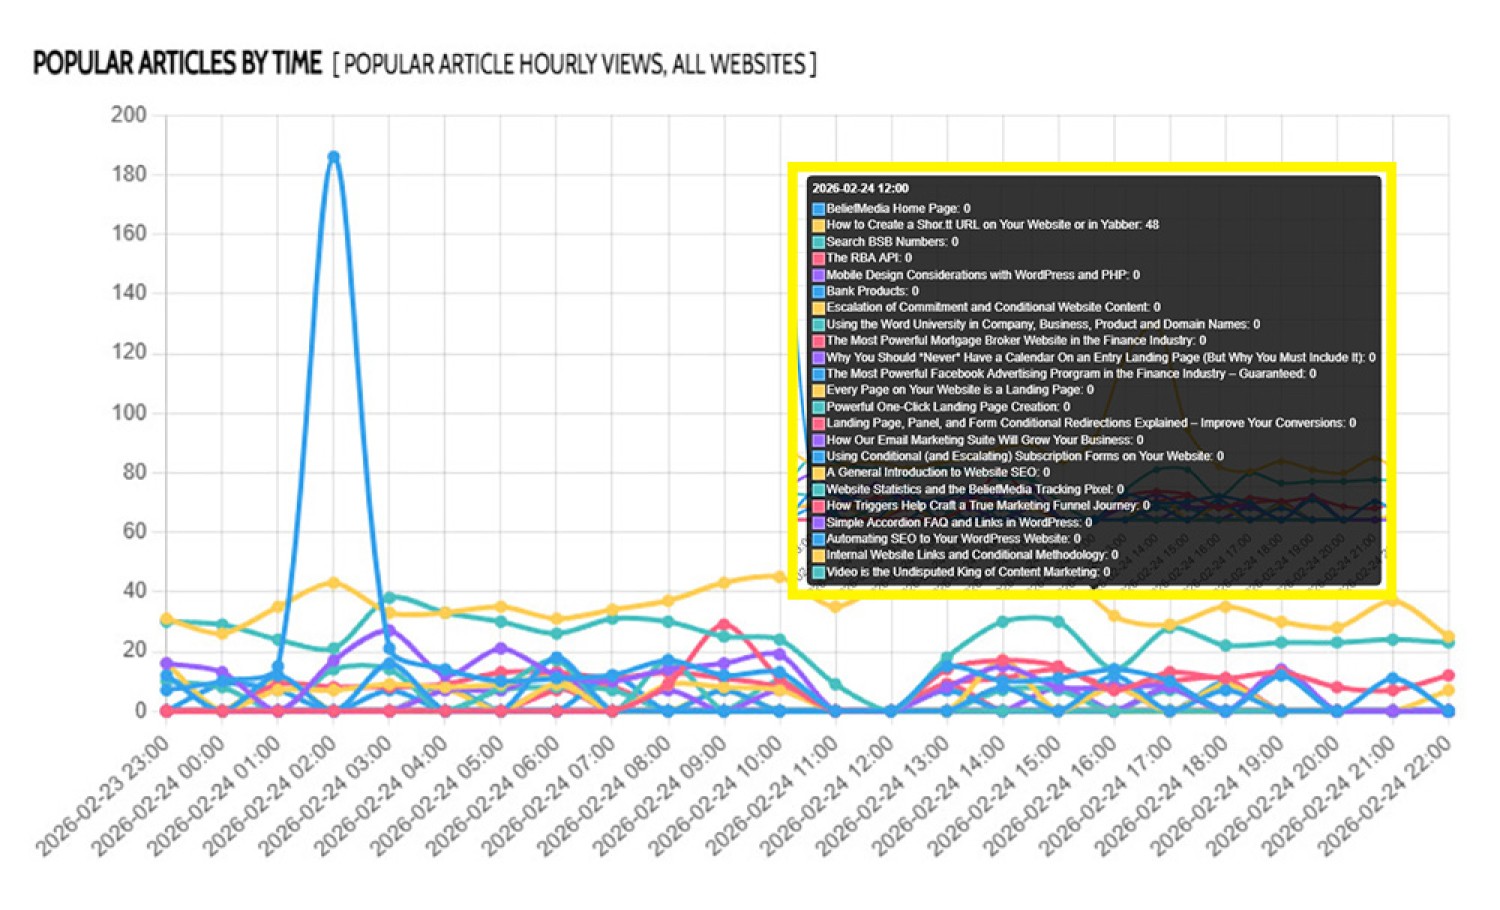
Pictured: The pictured chart is a trend of articles on our website, and it's one that I'll often refer to in order to narrow in on visitor trends. You'll note the spike; if you identify this in real time (or you have a 'Trending' trigger assigned to notify you), this is the time to narrow in on the article in question, or create a quick videos to capitalise on the interest. We regularly have news outlets links to articles, and it requires serious agility to first identify the spikes, but then to manufacture the content to maintain the momentum. It's an essential graph.
You won't garnish organic traffic if you don't have a website that is built around the pillars of expertise, education, experience, entertainment, and authoritativeness, and you won't improve on your search or social presence if you don't have a powerful SEO module that provides facilities on every page to showcase your content. You can't be expected to maintain a search presence if you don't have a clear content and social strategy in place, and if you're not using video, you'll be incrementally hidden deeper and deeper in the murky and rarely-navigated depts of search pages - normally anything other than the first page.
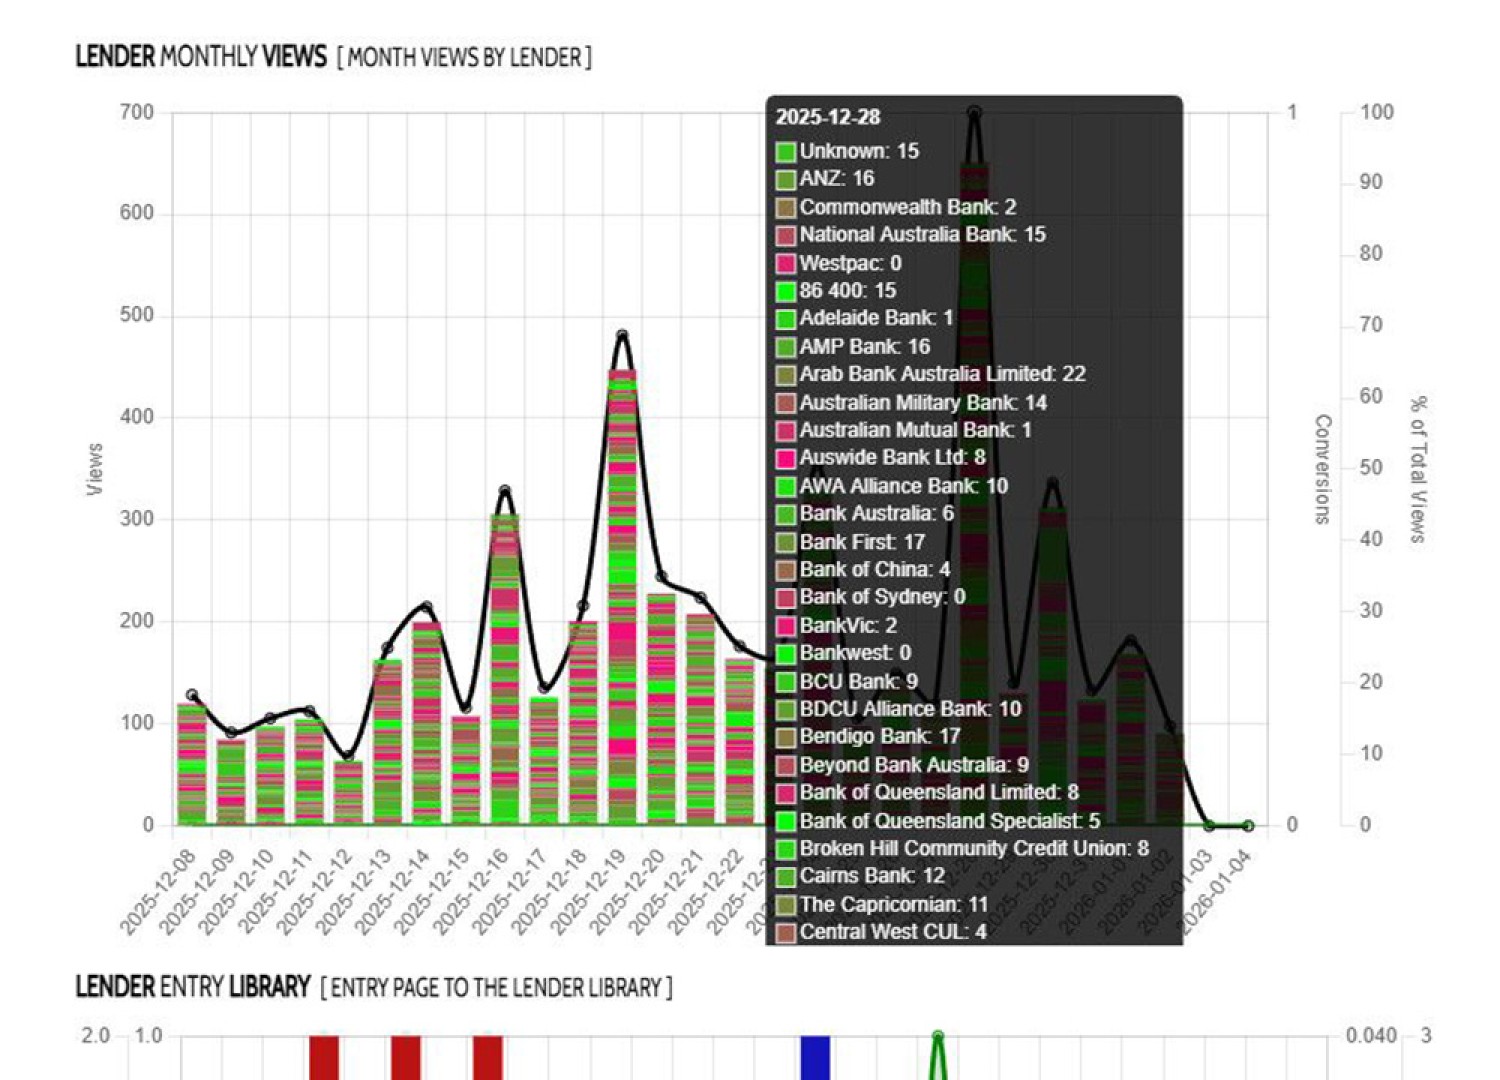
Pictured: Lender data is in strategic locations on our website. Don't confuse a 'rate-driven' ideology with the need for consumers to have access to information - the mutual exclusivity of these two competing agendas is rarely underwood. Consumers want rate data, and our average broker will see hundreds of daily visits which presents enormous opportunity to convert your visitors.
The reason your website doesn't convert is because generating business isn't your website architectural focus. Your website doesn't convert because it seeks to do nothing other than prove you exist.
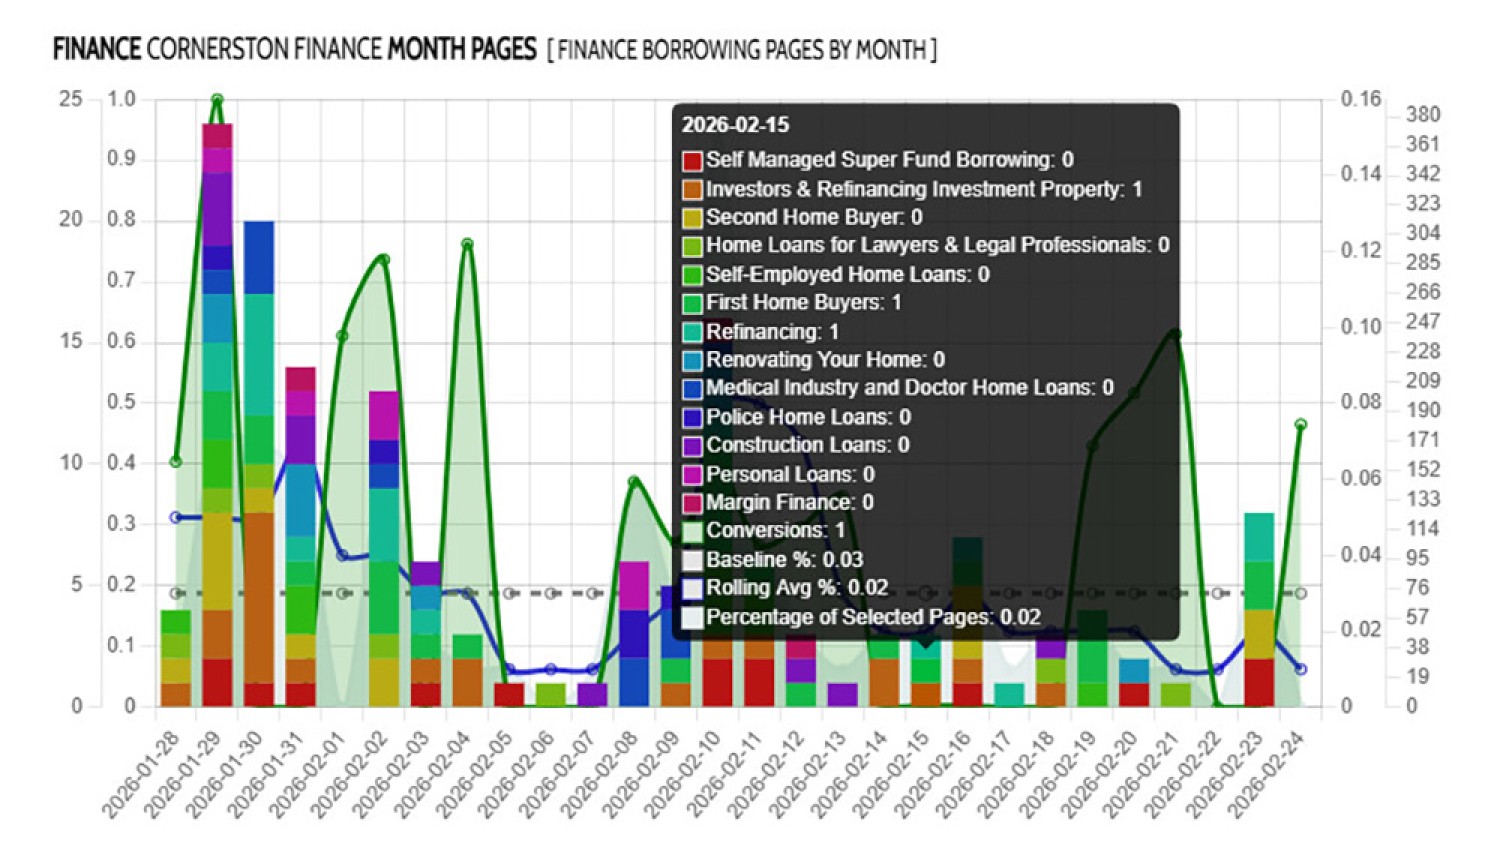
Pictured: Do you know how many visitors are viewing your First Home Buyer, Investor, or Refinance pages? You need to know this fundamental and basic piece of information in order to establish and understand your audience, and determine the predominant borrowing objective. This information shapes other areas of your business, such as content creation. Our conditional engine feeds off this engine in order to build a 'conditional' understanding of users (a big topic). We measure all evergreen and cornerstone pages, and your core finance product pages are stacked for an immediate understanding.
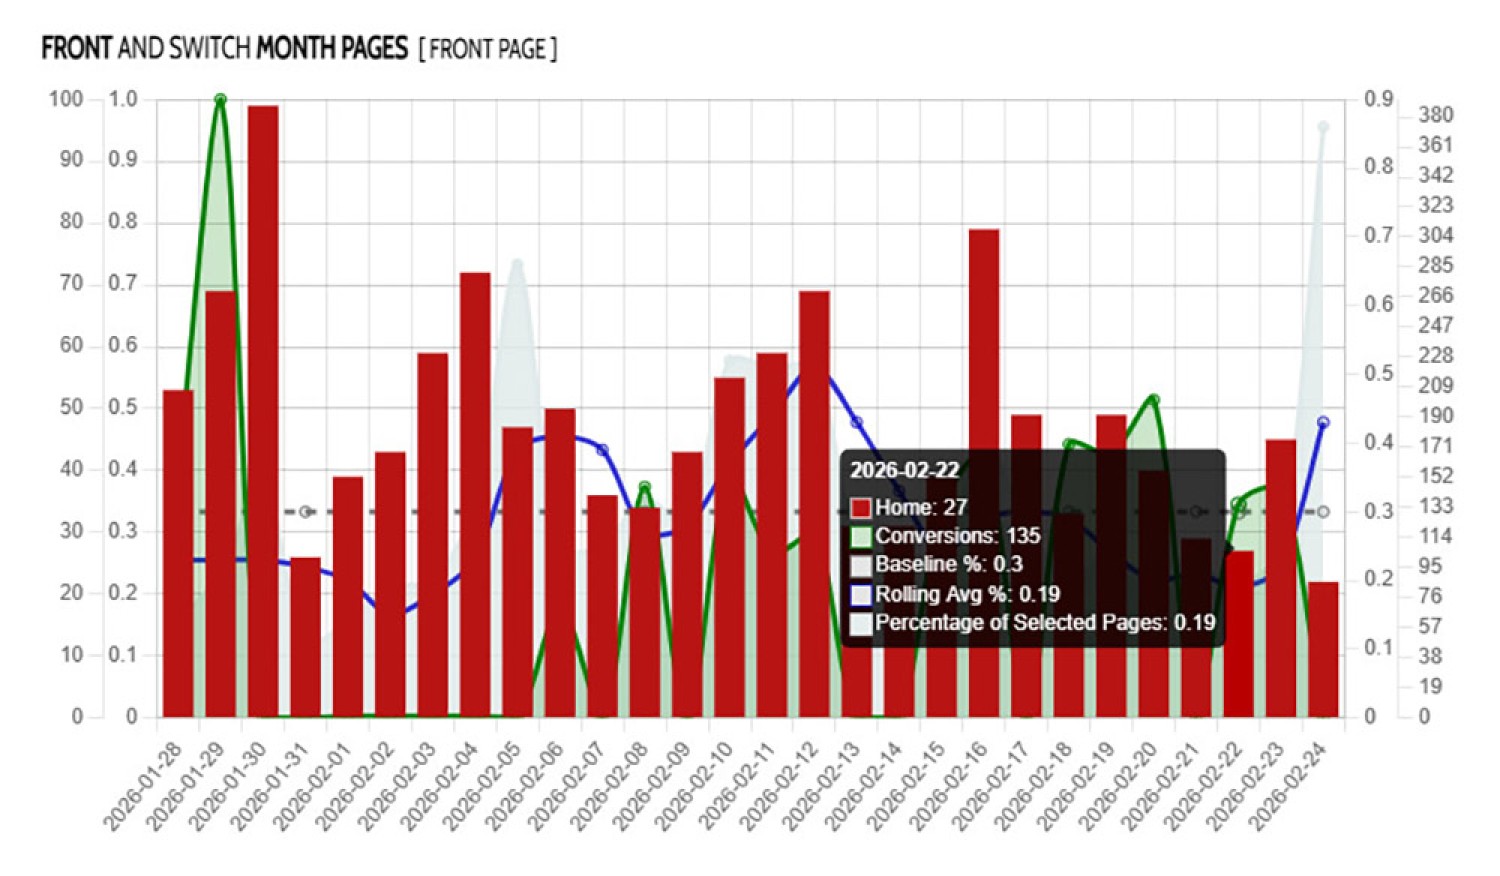
Pictured: The front page of your website is important... and your website includes at least 15 front pages. Managed via the Switch module, you may force an alternat from page for a specific user, or force an alternate front page based on the resoled interest of the website visitor. Front page stats show a stacked coloured bar chart of all front pages. The pictured user only uses their default front page. Alternate front page will be indicated by other colours, and the view/conversion count will be rendered in the tooltip.

Pictured: Your website includes a number of search tools and other single pages that need to be tracked in order to be understood. Shown is a small selection of these pages which includes Appointment and Contact pages, BSB Searches, Emergency Searches, third-tier searches, and 'General' pages. We also show stats for compliance -related pages individually. Another module allows you to group pages, meaning that you may review specific pages stacked in a single graph.
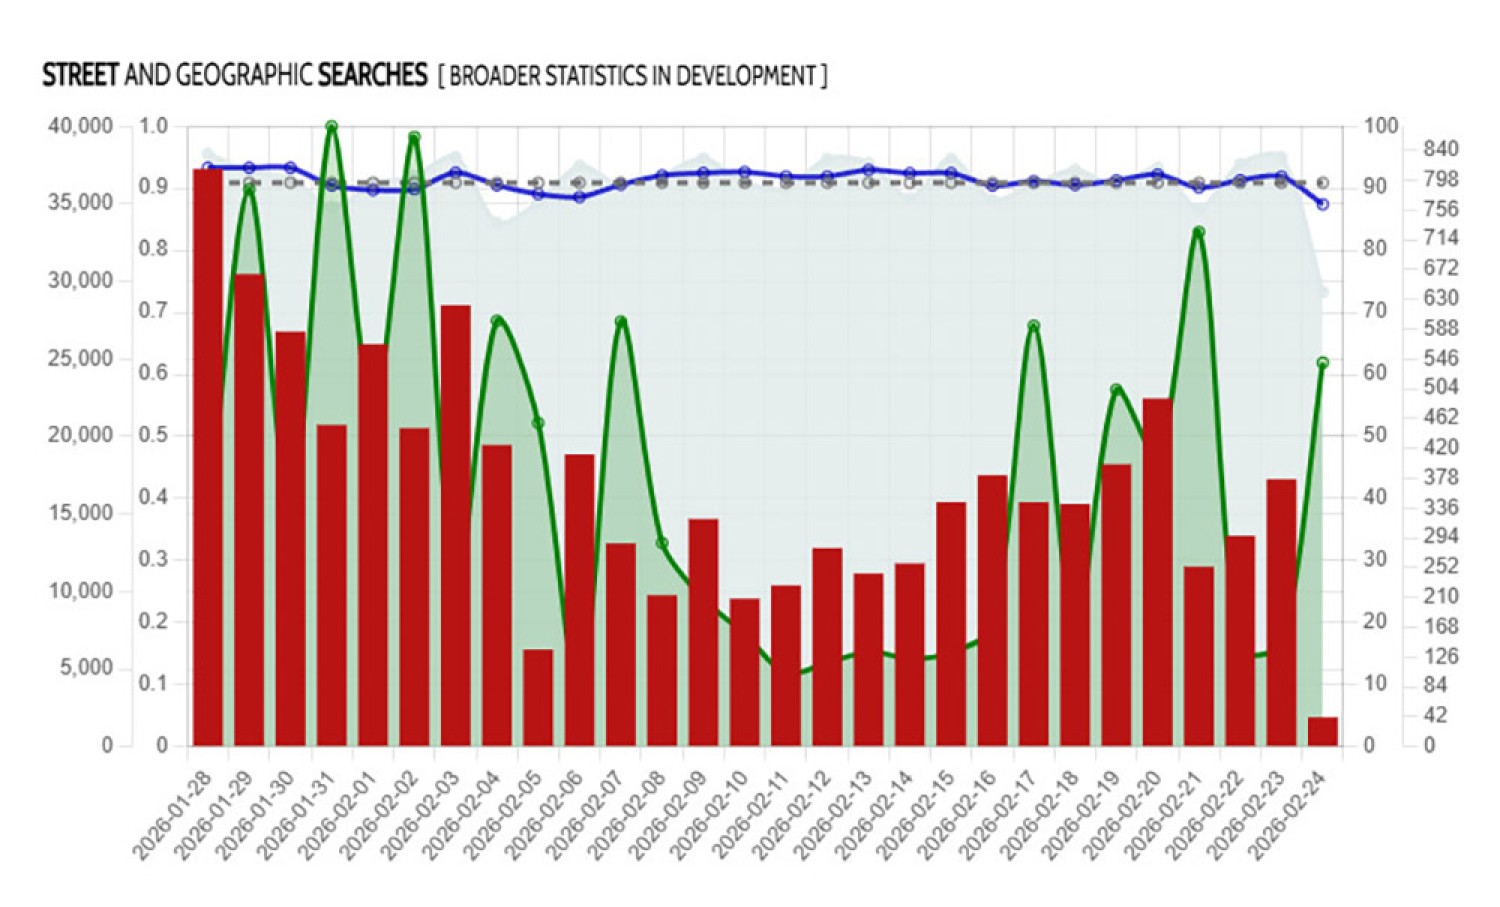
Pictured: Our Streets module is one of the most powerful tools on your website. The pictured user has a significant marketing spend and religiously sends users to the Streets pages for a property report, and this results in around 50 leads per day - all with a known address and verified phone number.
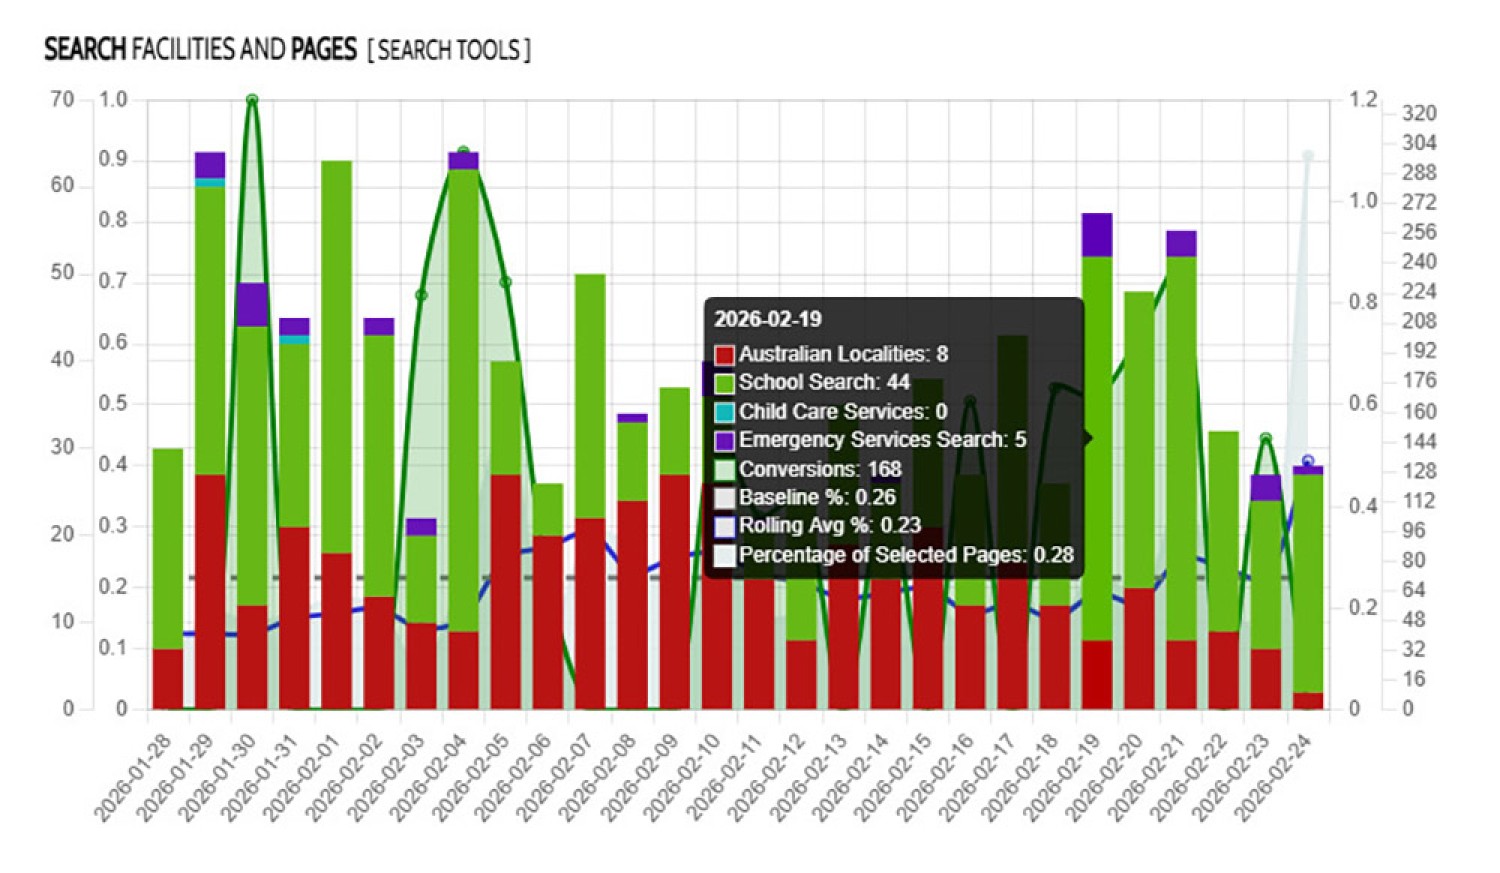
Pictured: An aggregated graph of secondary (and less-commonly visited) search facilities are bundles into a single graph so you're able to assess the performance of some 'hidden' pages.
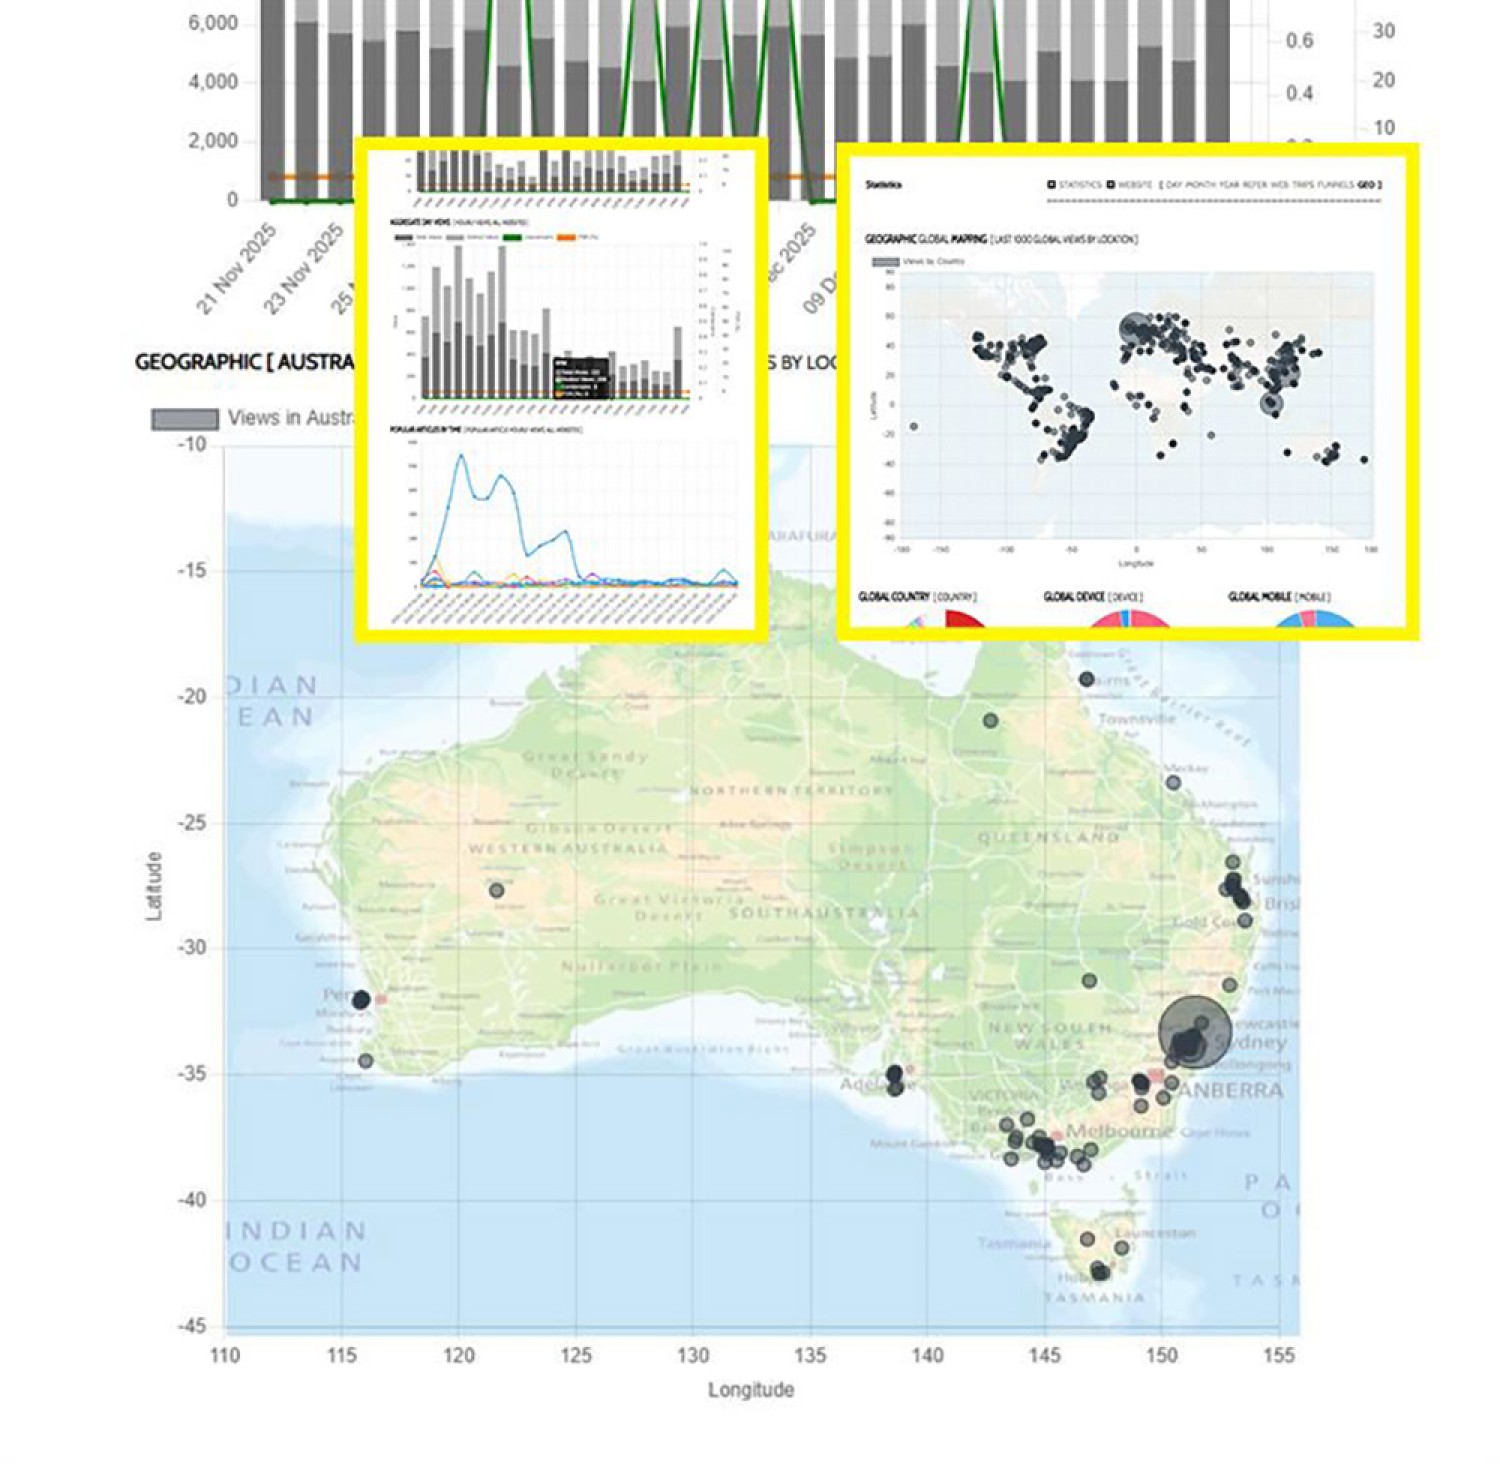
Pictured: Actions of all types are resolved to a geographic coordinate along with suburb, state, country etc., and all geographic data is returned in various formats for most modules. Where required, Australian data is shown independent of global data. A chart is also returned for visits near your business location - a tool we use for local SEO performance.
There are hundreds of articles on our website that details how and why our website converts in far higher numbers than competing solutions, and why our paid promotion programs return far, far, more leads, but that isn't the focus of this article. Instead, understand that the deeply nested Xena statistical module paints a clear picture of your performance that is unmatched by anybody else. Further, Xena is a default part of our core product. In fact, our heatmap and scroll modules alone might cost you more than $200 per month using a commercial service.
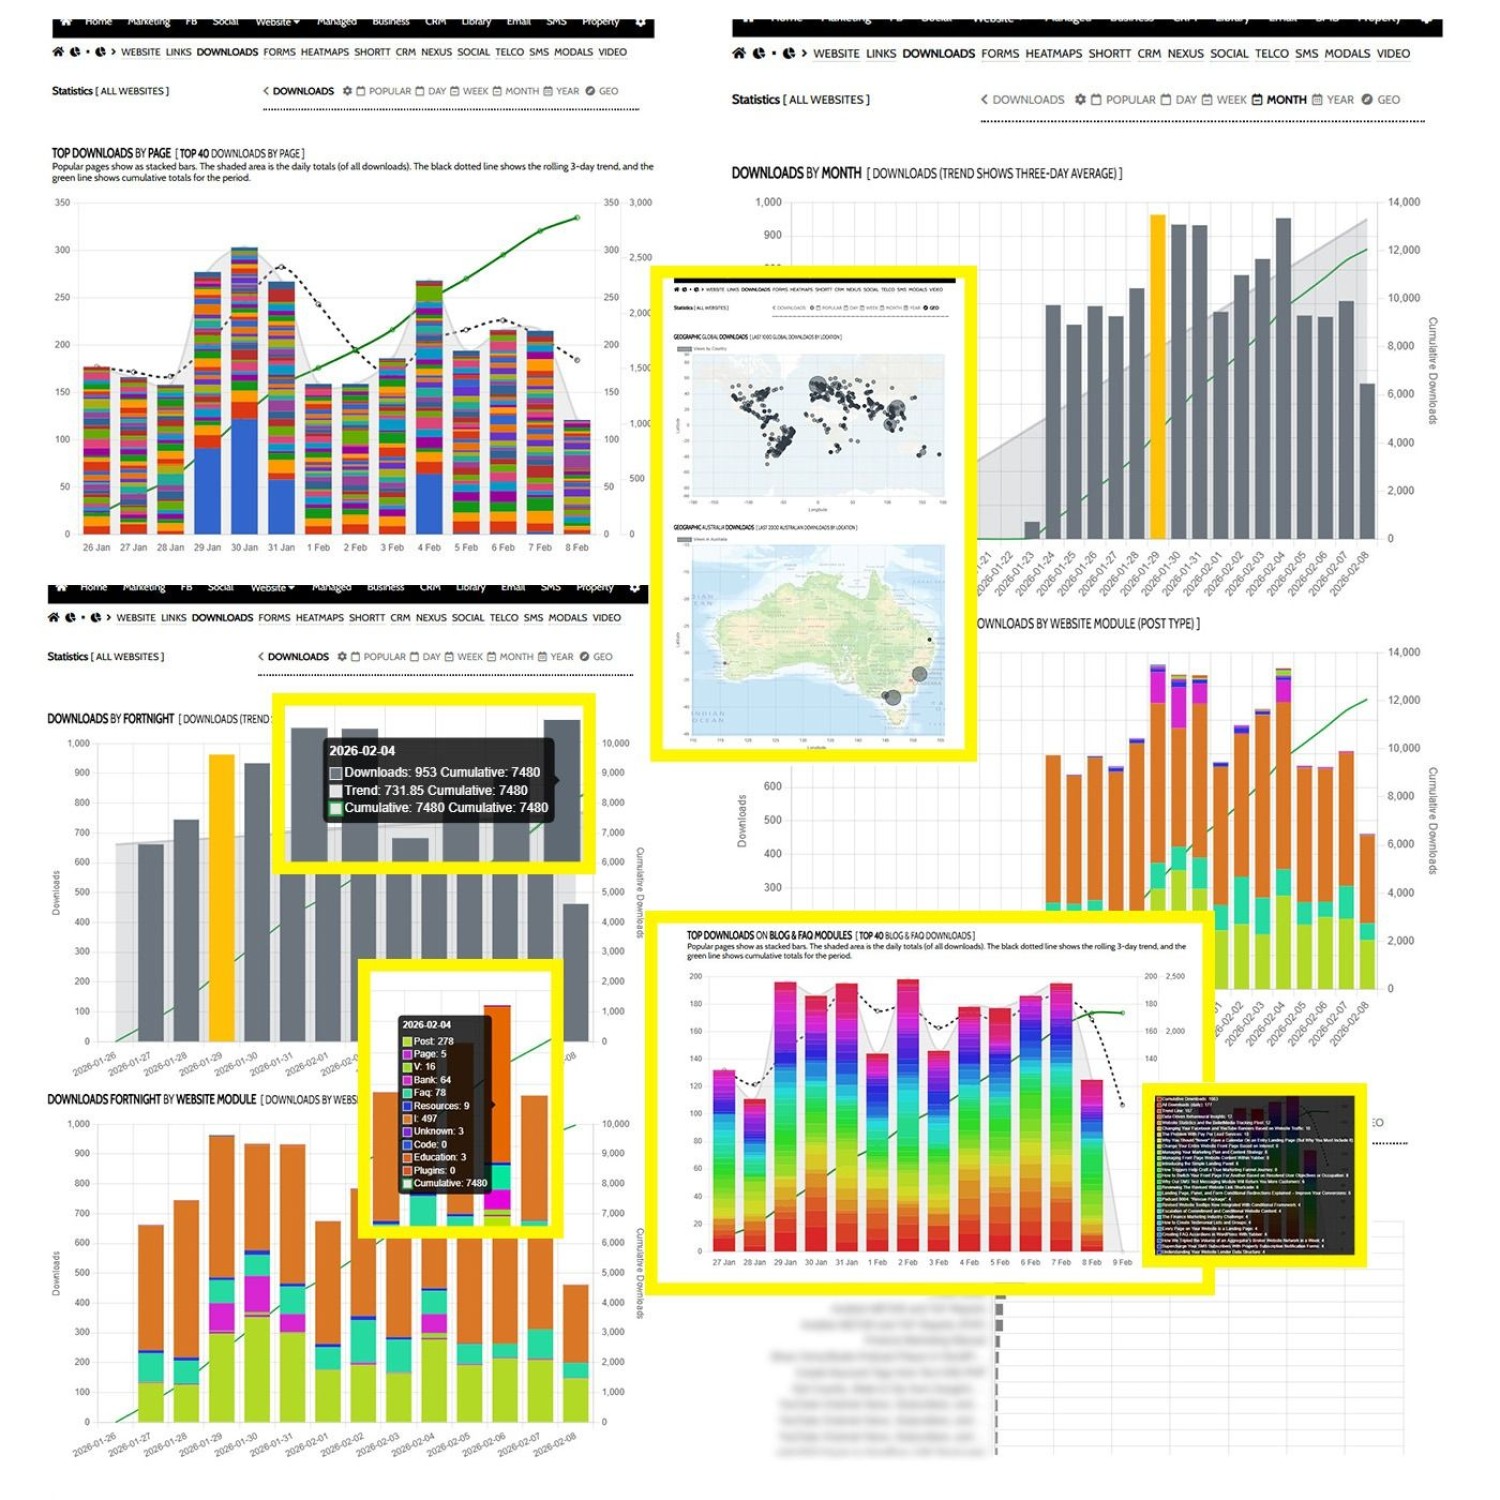
Pictured: All the data recorded for website page views are also applied to downloads, so we know the page, post type (module), geography, along with around 35 other data points. Resolved to specific users, downloads are a common marketing trigger source. The graphs include trend overlays and conversion counts. It's one of those graphs that is absolutely essential.
Bottom line: you won't be able to improve on something if you don't know how it's performing.
Data-Driven Behavioural Insights
In a very old article titled "Data-Driven Behavioural Insights", we looked at the importance of having tactile feedback on all digital interactions in order to shape decision making of any type. If you don't have data, you're operating on rhetoric and guesswork, and this void of meaningful insights makes your agile marketing efforts as reliable as calculating the global ratio of unicorns to leprechauns. Sadly, most businesses are traversing the digital space entirely blind and completely oblivious to the opportunities that pass them by.
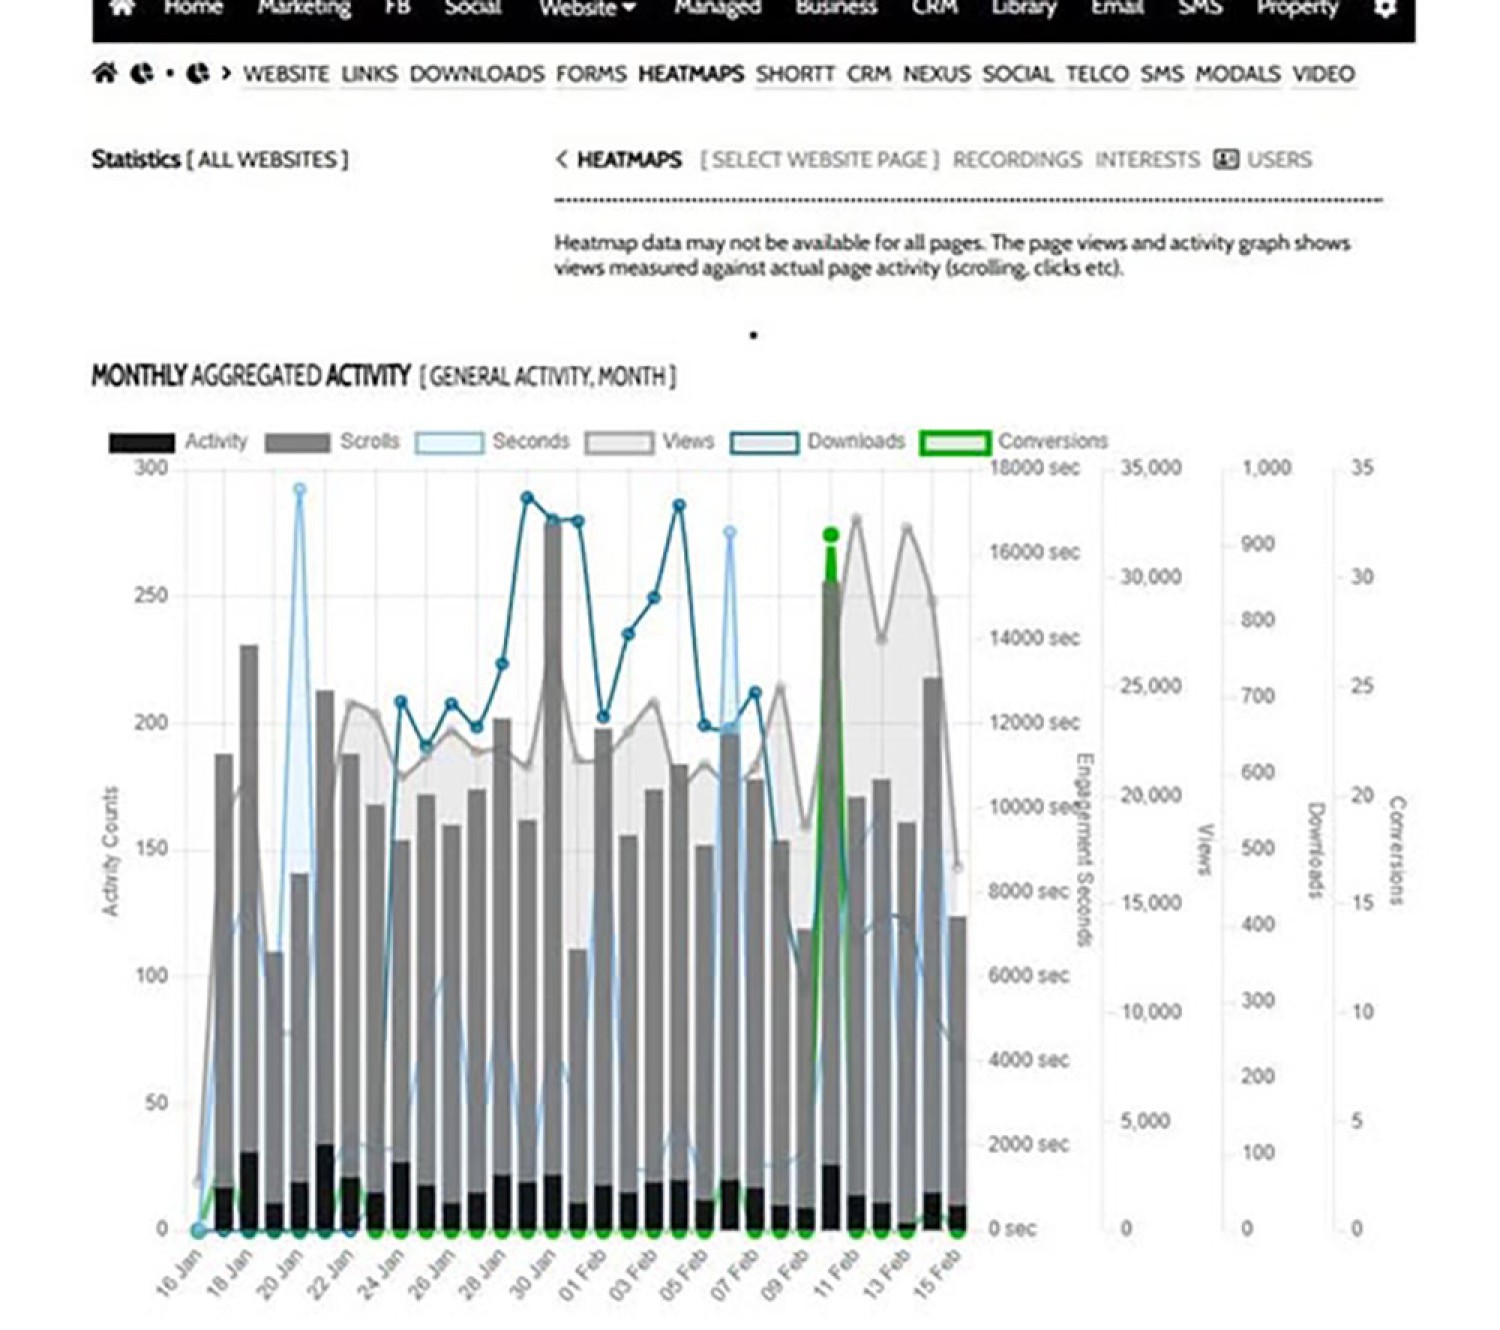
Pictured: The pictured graph is an important one, and it's a derivative of the Core Temperature Graph. The graph shows general activity, scroll movements, seconds on page, views, downloads, and conversions. As part of the heatmap module, the bar component of the graph shows page activity (essentially measuring the clicks and movements). The activity component of this graph will be updated to include basic mouse track data over the next couple of weeks.
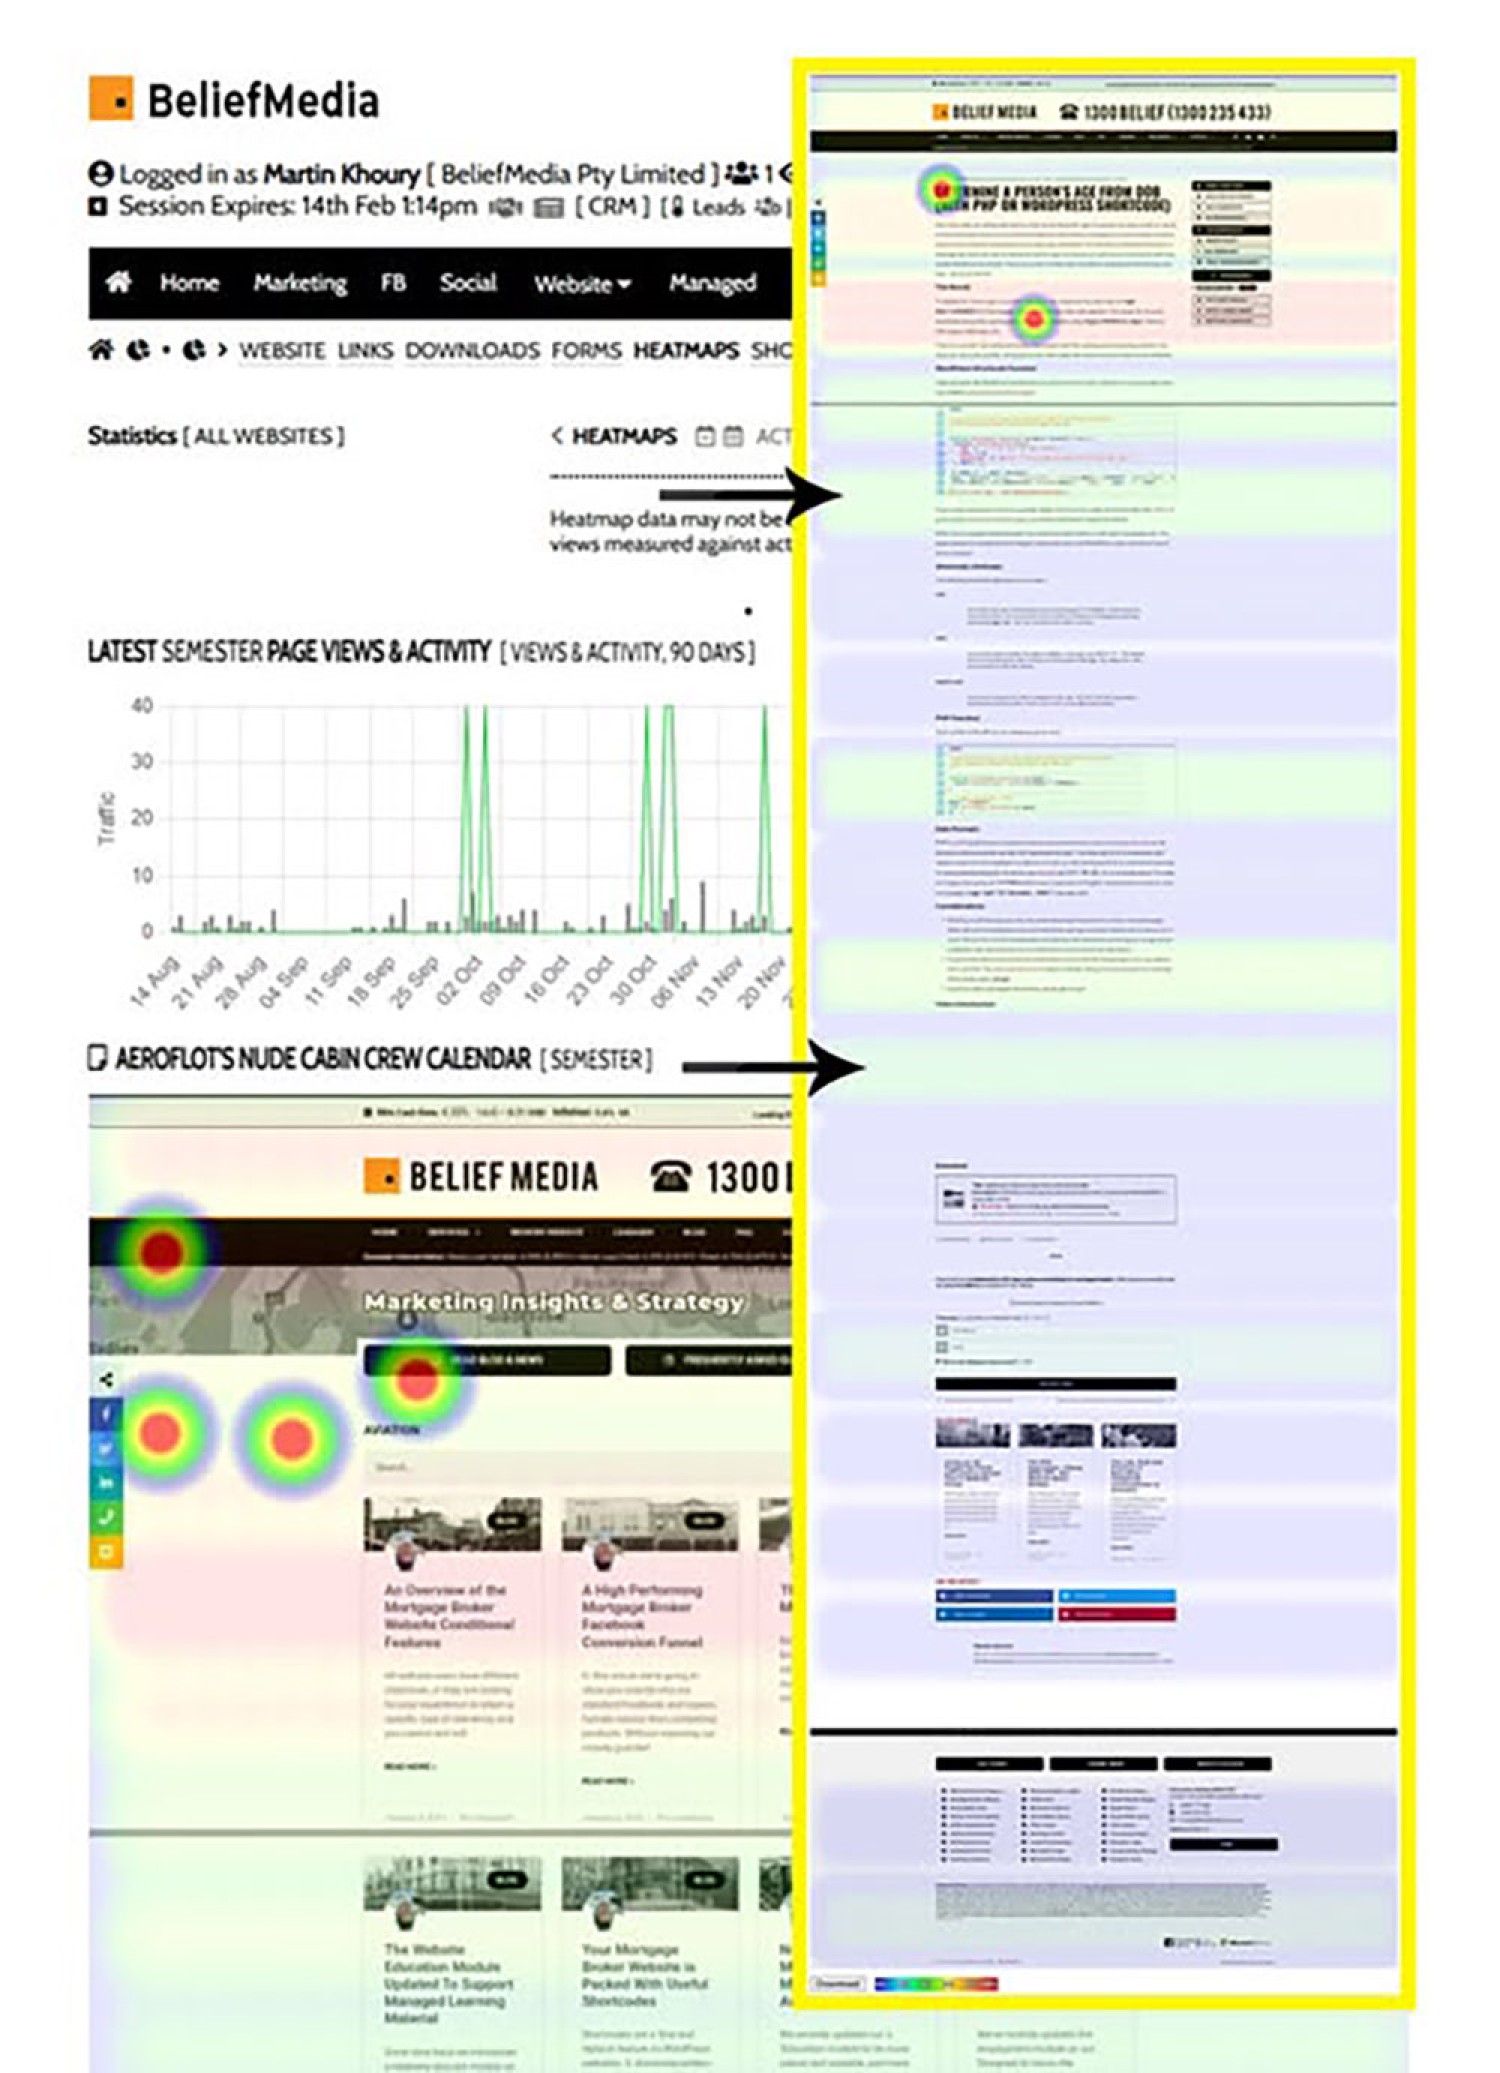
Pictured: This heatmap shows where users focus their attention on landing pages, identifying high-engagement zones and potential bottlenecks in the conversion funnel. Heatmaps are arguably one of the most important statistical modules you can use, and if you're engaged with paid promotion, any budget you throw at Facebook or elsewhere is seriously compromised unless you have heat and scroll data. It's one thing to split test landing pages - a bread-and-butter requirement - but the necessity to evaluate landing page performance simply cannot be actioned unless you're able to visually assess page interactions. I tends to get angry at the industry because I see poor performance on the back of pages that could be corrected with a very simple single heatmap. The heat module also plays back entire user sessions in real time... but this module remains the domain of our managed groups.
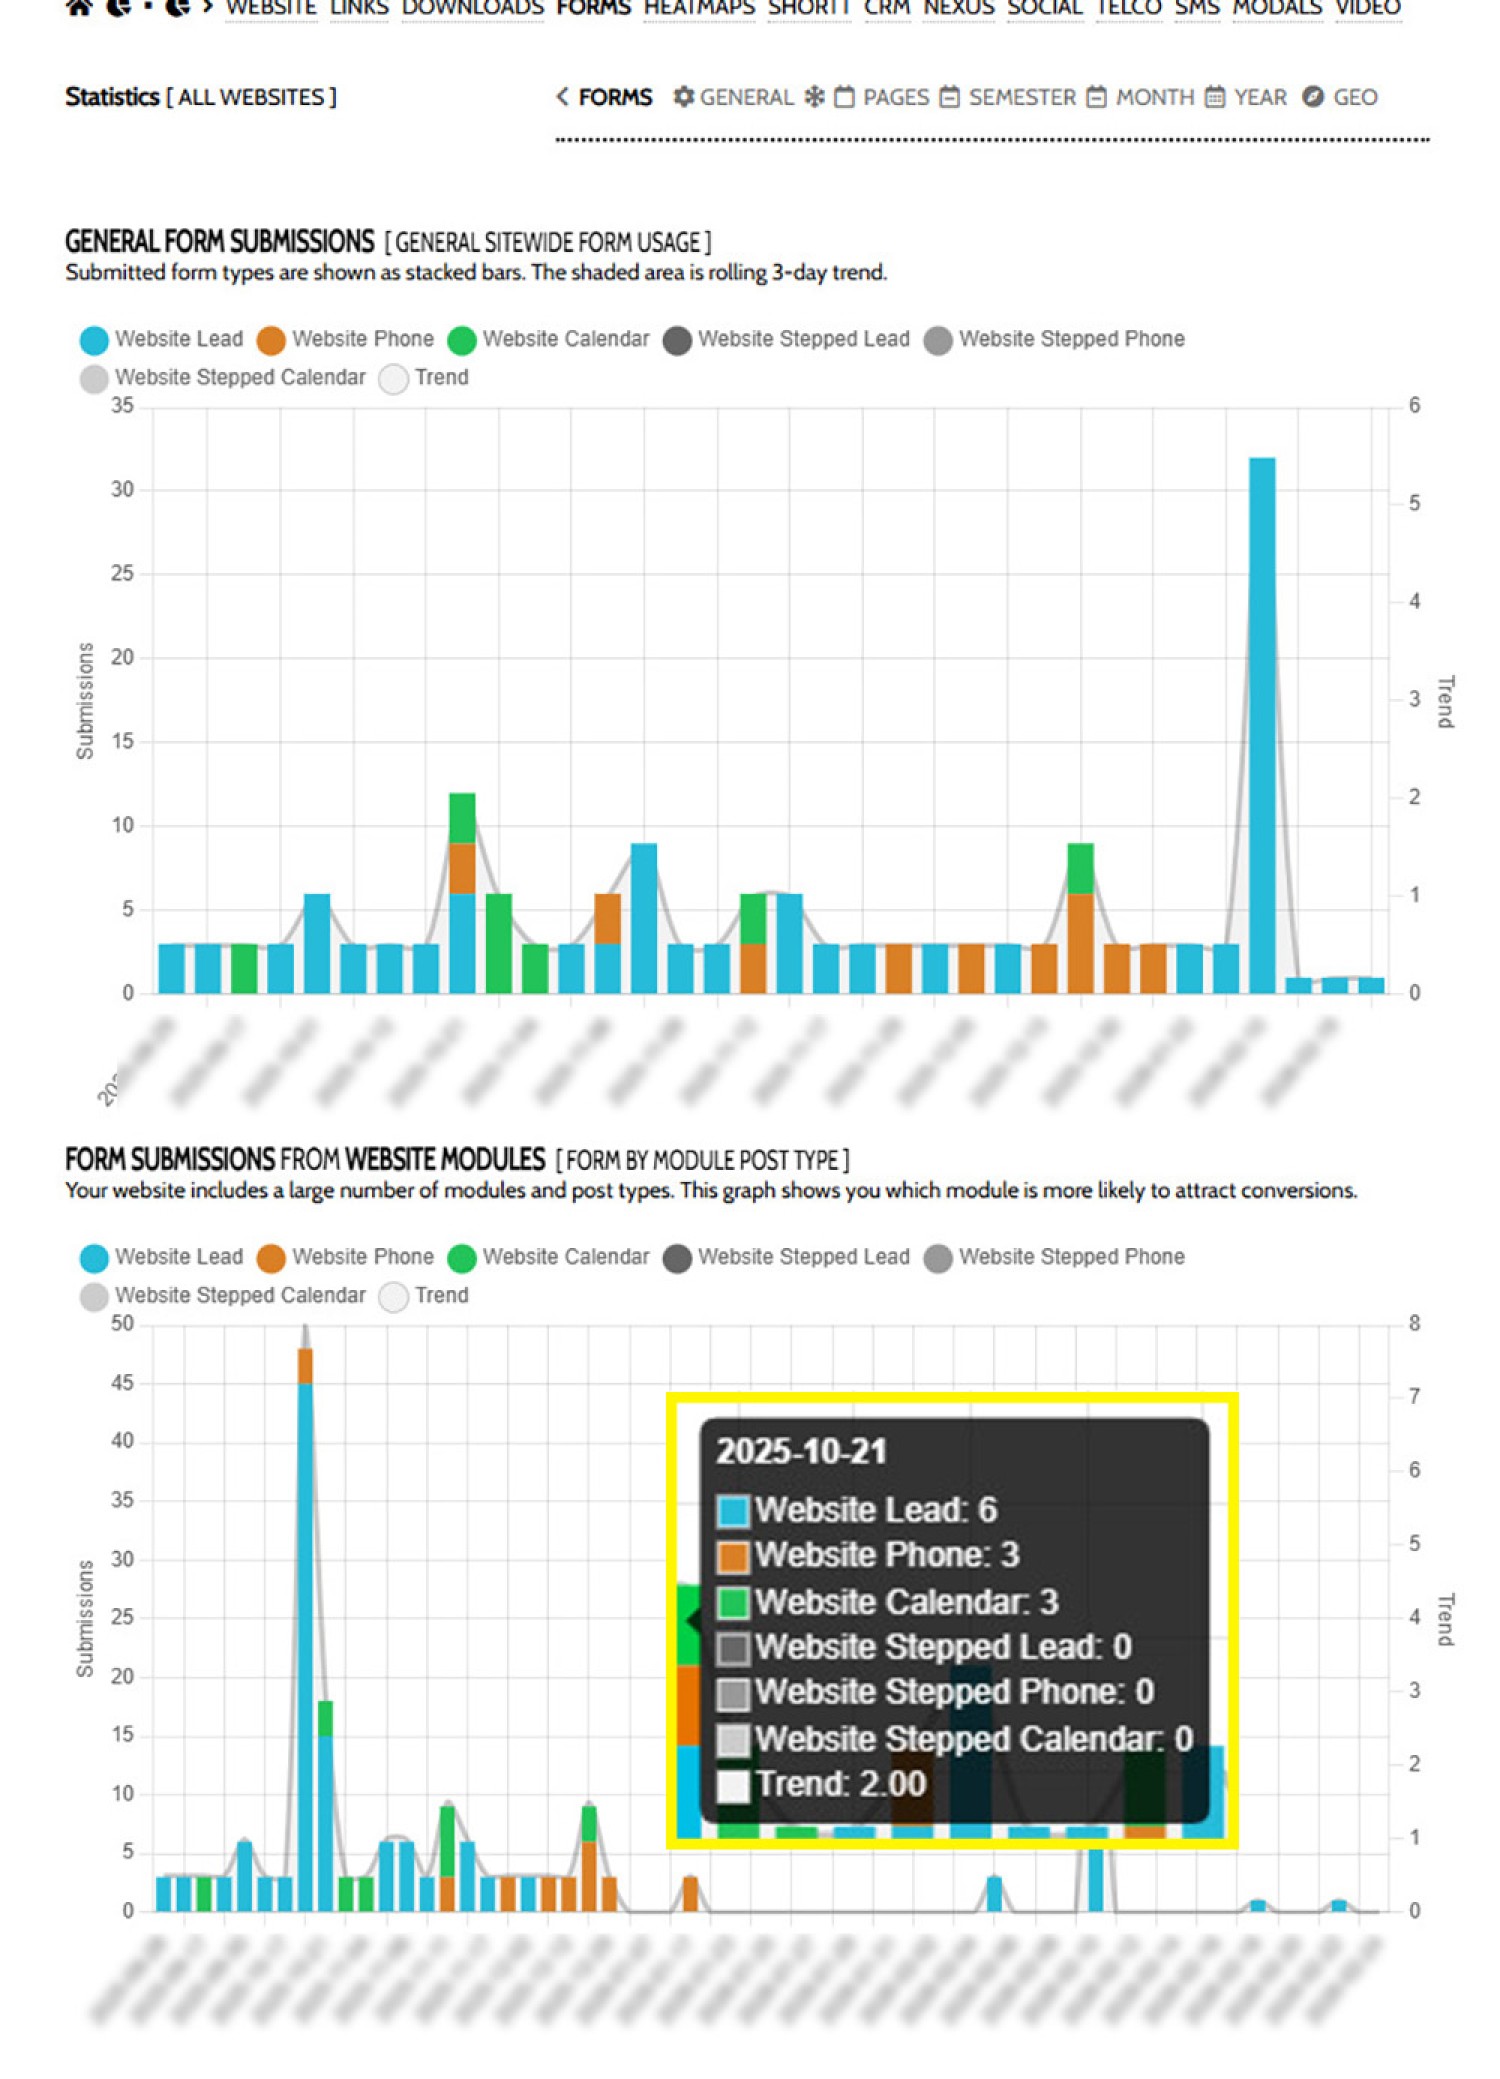
Pictured: The way the industry works is that forms are often a third-party tool that plugs into a page (or landing page) - an entirely clumsy solution. Via our Formly module, our forms, Outlook-integrated calendars, stepped forms, and all form components, are fully and entirely integrated with our Yabber system. Because of this tight native integration, we're able to measure the performance of forms by page, post type, geography, position on page, and about 30 other big-ticket attributes. The security implications of third-party tools is so significant that we've banned a number of clumsy tools on our servers. Forms are measured by lead type (email, phone, subscriber) and segregated by form type (standard form, fact find, stepped form etc).
Landing Pages and Heatmaps: The understanding of landing page traffic measured against internal website views and conversions is a core necessity that is often ignored overlooked by those that provide any flavour of leadgen service, and the data returned via our Landing Page system is unmatched in every respect. You can't improve something if you don't understand how it's performing. Scroll maps and heat data on landing pages are essential, and if your digital representation doesn't provide this data, it might be time to karate-kick them back into the pool of mediocrity where they belong.
Granular Statistics
It's no secret that our methods return far more volume and conversions than competing solutions (we even offered a million dollars to any broker that didn't improve Facebook advertising conversion by 300%), and a lot of this comes down to a granular understanding of funnel traffic. Yabber provides the only integration solution in the industry, meaning that the data source is very much a singularity, so it doesn't matter if you're using the email marketing suite or working on your website, the user is tracked to the same source. Downloads, web visits, lick clicks, email click, modals, tooltips, and just about everything else, is all tracked in the same way, evaluated for triggers from the same source, and actioned with predictable uniformity. All of your digital assets are linked via funnel pathways, and each conversion can be resolved back to very specific behaviour, meaning that reliable mechanisms can be used to build an entirely predictable conversion matrix.
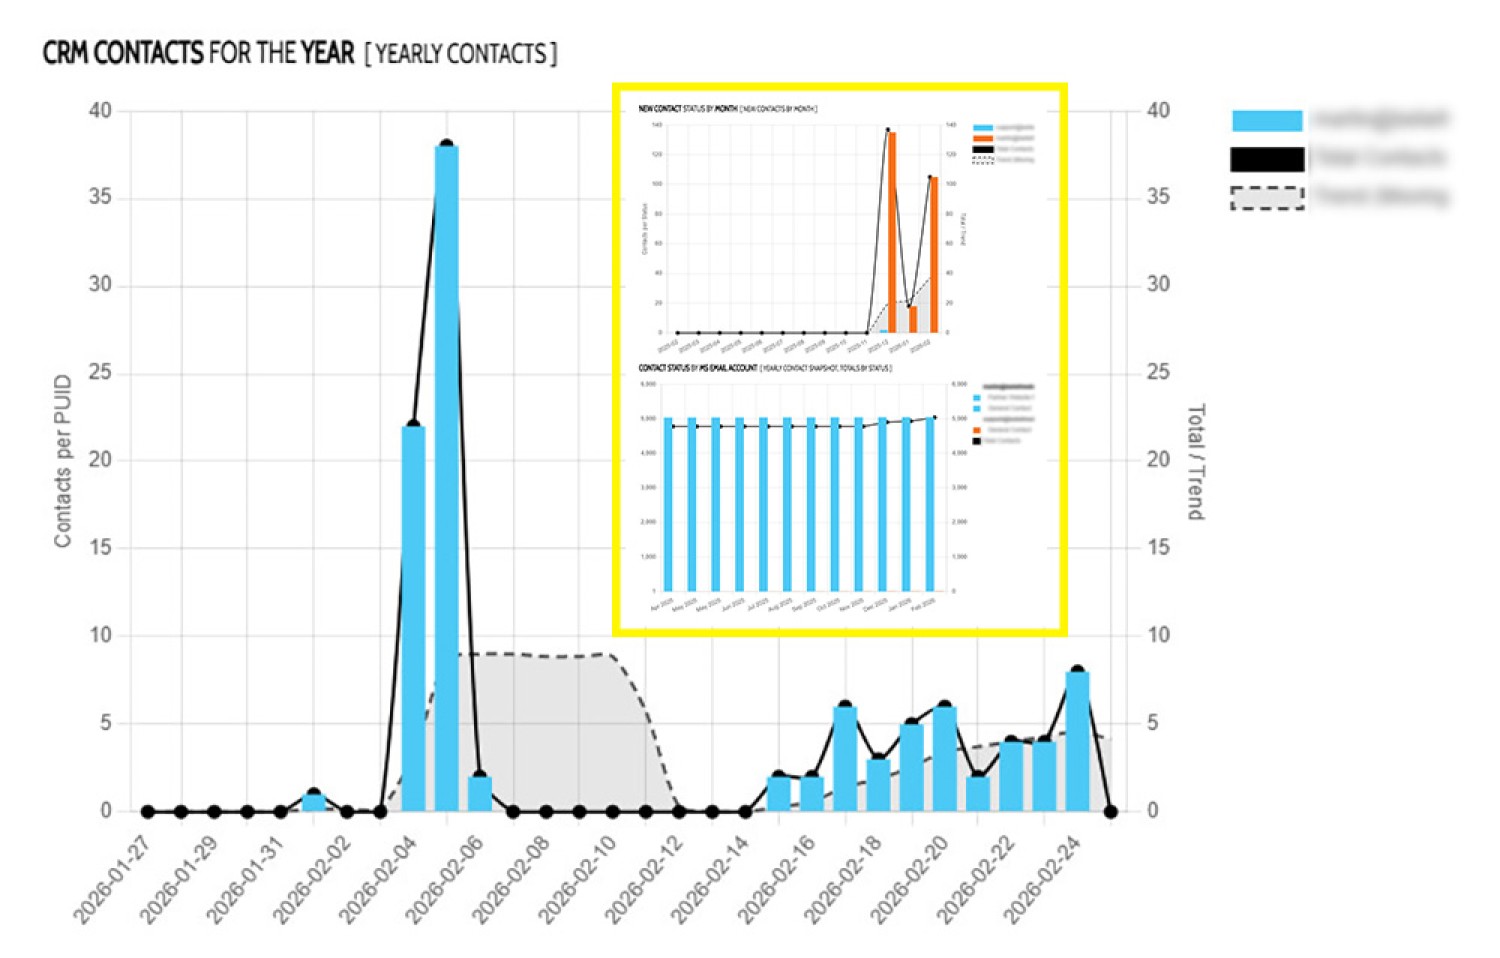
Pictured: Microsoft Contacts have become te only source of content we use for email and SMS marketing, thus giving you complete portable ownership of your data. Various graphs exists that'll indicate the number of contacts registered to your various Microsoft accounts.
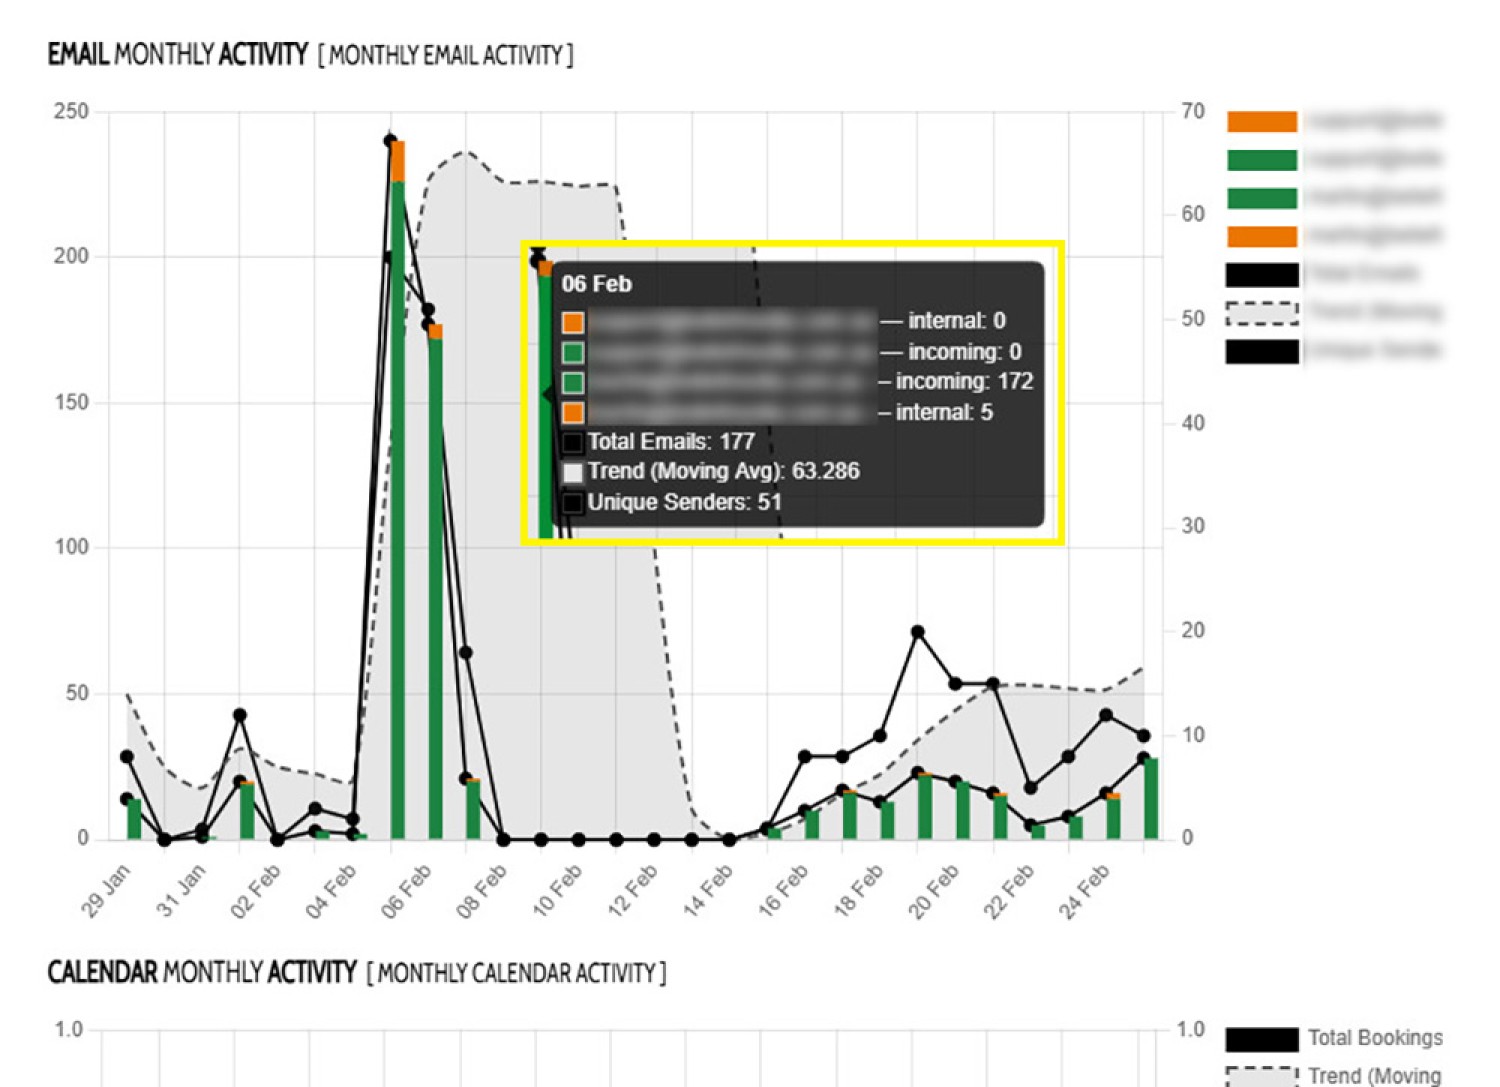
Pictured: The number of emails received and sent via various sources and accounts is a key metric in measuring business performance. The graph above is indicative of a large number of similar examples that shows daily contact activity. Paired with VoiP call logs and general web data, it contributes heavily in the calculation of the single Singularity figure used to determine conversion scores.
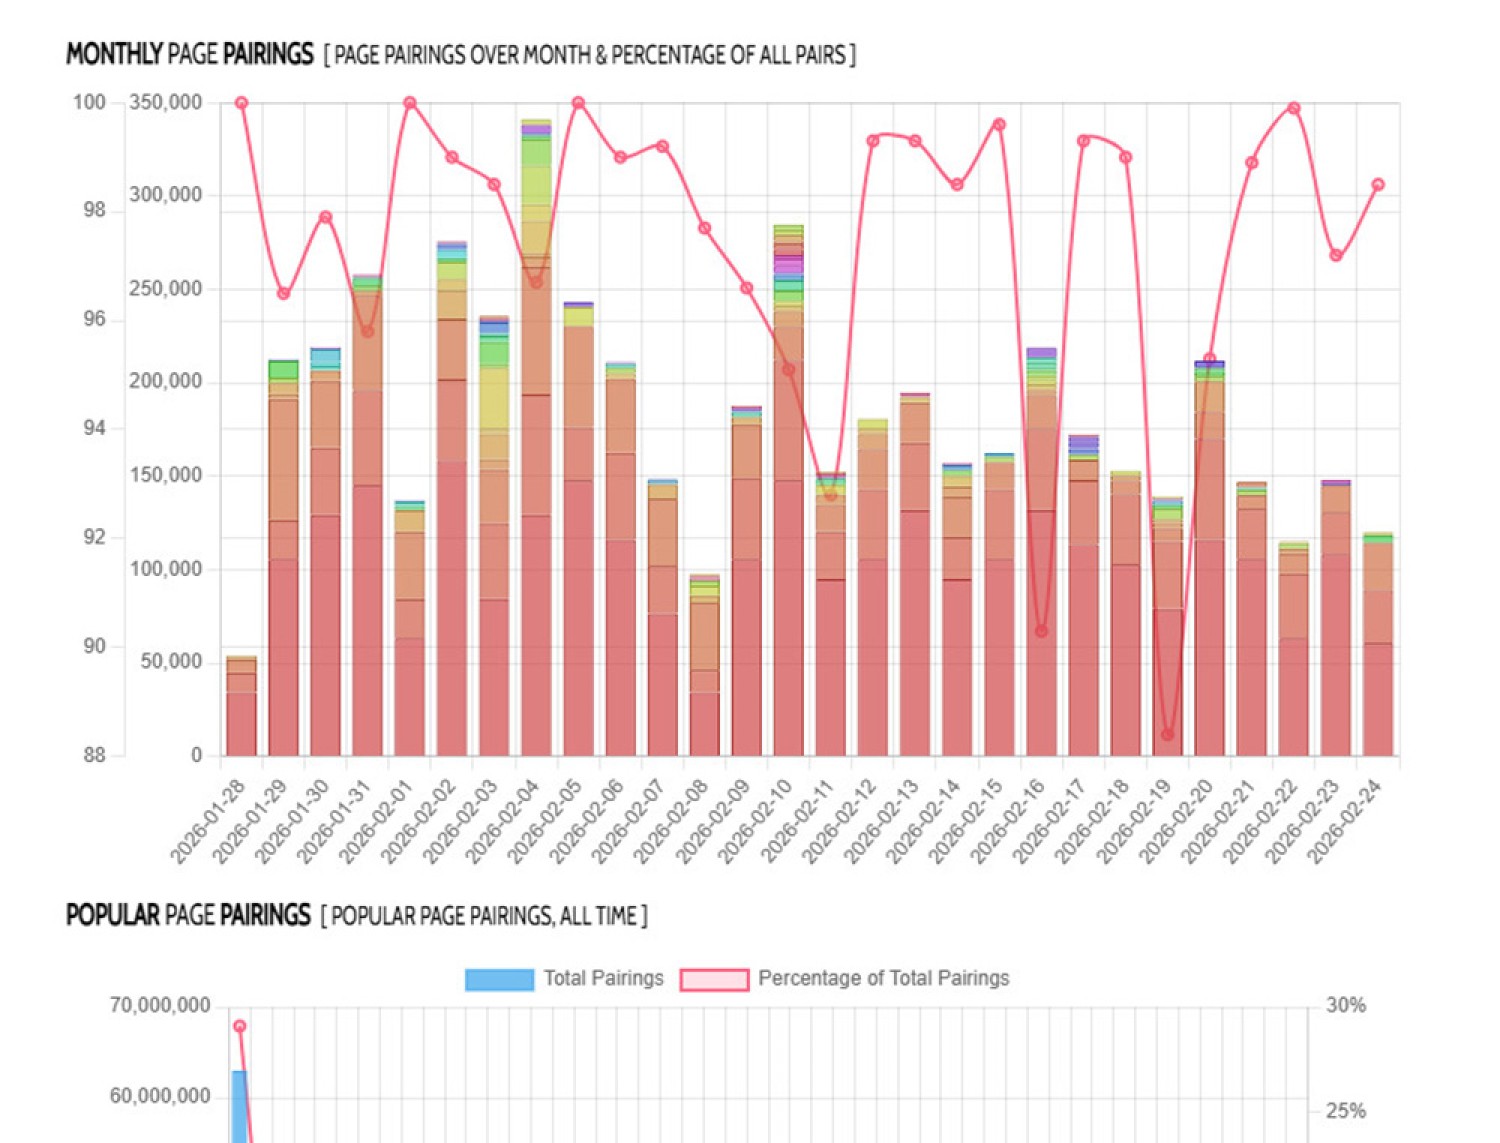
Pictured: The funnel analytics aren't introduced in any serious way in this article. However, we record hundreds of data points for each and every visit, such as the pictured pairings, or the to and from page in order to resolve one-step pathways. We record triplets in the same way, and each conversion triggers the creation of the pathway matrix. The funnel data is extensive, awesome, and insightful.
In essence, Xena has improved on the efficiency of the statistical engine and not necessarily the core functionality. However, the data that may now be returned is far more granular, and more meaningful comparisons that were once available only to us are now returned via standard graphs. The updated Xena API is extremely robust in that custom reports may be generated, or custom comparison graphs may be created.
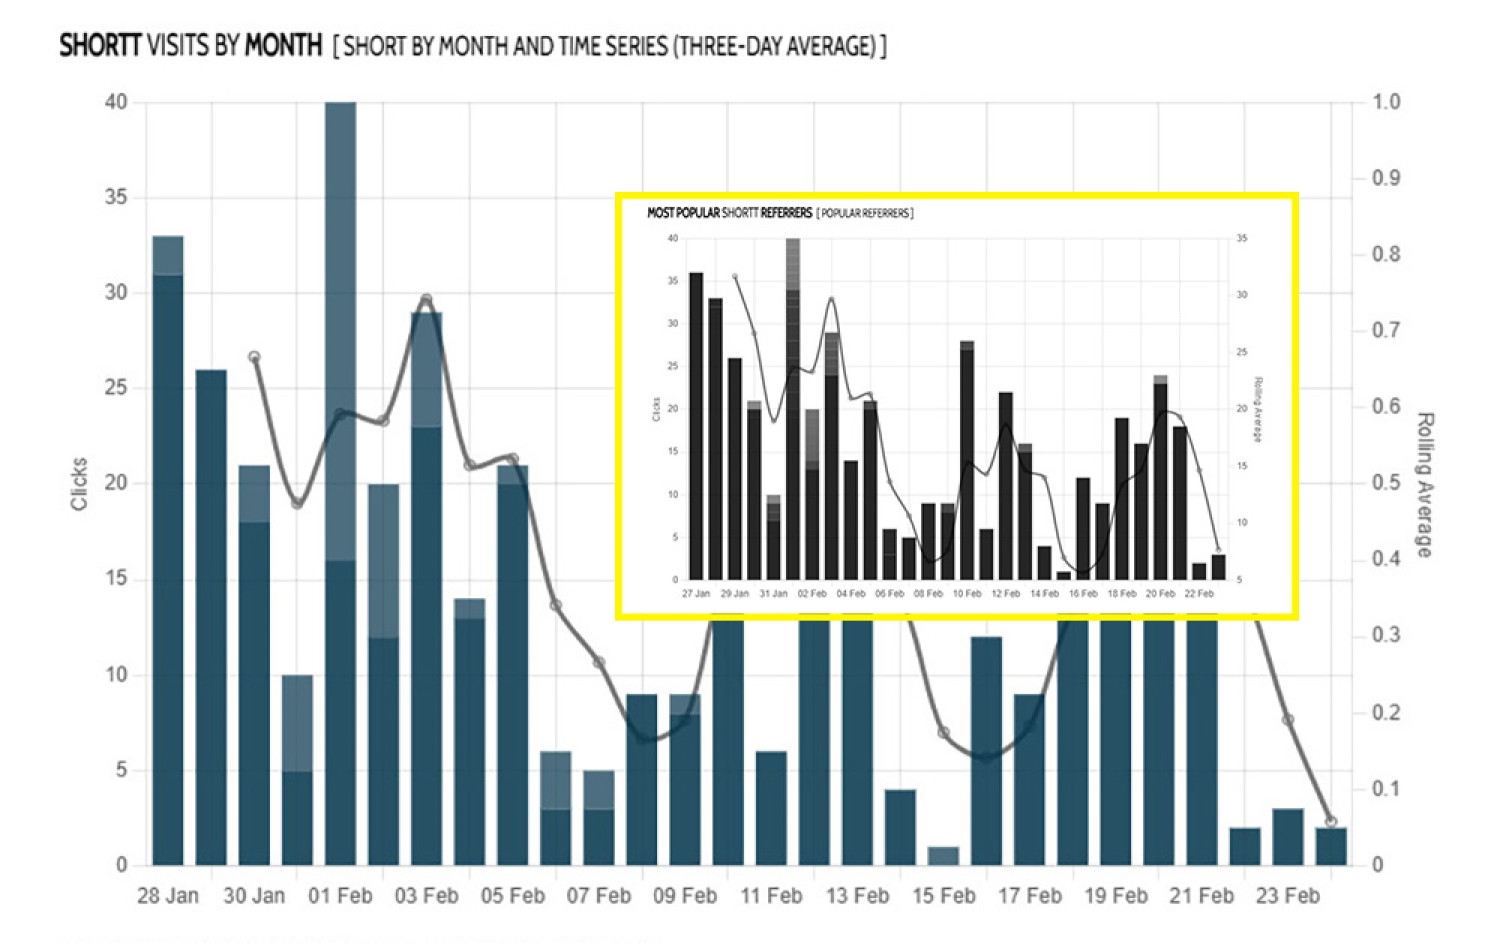
Pictured: We highly discourage third-party URL shorteners, and recommend businesses use their own shortener or our own general service at shor.tt. Shortt is intrinsically connected to all aspects of the digital engine, so usage of the tool doesn't compromise on statistical performance.
In previous versions of statistics, we generally returned aggregated information, so it was occasionally difficult to resolve what pages were converting more than any other, and what pages attracted more traffic when compared against others. Xena uses hundreds of data points to filter data as required, but it's the big-picture facilities such as post type comparisons, search comparisons, segregated blog and FAQ charts, geographic, lender, and other siloed modules, that can now be assessed individually with data indicating sitewide relevance. Other charts compare link popularity, modal usage, and funnel nested channels - all of which gives you the insights necessary to understand broad conversion-focused decision-making strategies.
Conclusion
Data is the foundation of modern business intelligence, but its value is not intrinsic - it is realized only when collected, structured, and interpreted in a way that drives actionable decisions. Xena represents the apex of this process: billions of individual data points from every module, every campaign, every page, and every user interaction are unified into a single, coherent engine. Unlike fragmented solutions, Xena eliminates silos, integrating CRM activity, marketing automation, landing pages, web traffic, and user engagement metrics. This unified architecture ensures that each insight is derived from a comprehensive view of operations, allowing businesses to understand not just isolated events, but the systemic dynamics that govern performance across the entire digital ecosystem.
The insights generated by Xena go far beyond basic metrics. By correlating behavioural data with transactional outcomes, the engine produces predictive intelligence, revealing which actions are most likely to generate conversions and which channels yield the highest return on investment. Features like the Singularity, user temperature mapping, and geo-resolved interaction data allow businesses to anticipate opportunities and bottlenecks with a level of precision that is simply unavailable in conventional analytics platforms. This predictive capability transforms Xena from a passive reporting tool into an active decision-making framework, enabling real-time strategy adjustment and hyper-targeted interventions across marketing and operational channels.
From a competitive standpoint, Xena provides an unparalleled advantage. Most statistical tools in the industry are reactive, presenting aggregated historical data that must be interpreted in isolation. Xena, in contrast, merges historical data with near-real-time behavioural signals, producing contextually rich insights that are immediately actionable. Businesses that leverage Xena gain a multidimensional view of their operations — identifying which modules, campaigns, and landing pages drive engagement, understanding how content interacts with audiences at a granular level, and measuring the performance of both organic and paid promotion with precision. This depth and granularity cannot be replicated by off-the-shelf solutions, making Xena not merely a tool but a strategic differentiator.
The architecture behind Xena also ensures that these insights are scalable and adaptive. With AI-first design principles and a foundation built on billions of data points, the engine continuously learns and refines predictive models as new data flows in. This adaptive intelligence allows businesses to evolve strategies in step with their audience, identify emerging trends before they become apparent in traditional reporting, and make data-driven adjustments that maximize conversion efficiency. In practical terms, this means less wasted spend, higher lead quality, more efficient funnel optimization, and the ability to confidently execute campaigns at scale without guesswork.
Ultimately, Xena delivers not only data, but clarity, foresight, and strategic advantage. The engine transforms complex, multi-source interactions into actionable intelligence, giving businesses the ability to optimise every touchpoint along the customer journey. By providing insights that are comprehensive, predictive, and precise, Xena enables a level of operational sophistication that competitors cannot match. For any organisation seeking to turn analytics into a core business advantage, Xena is not optional - it is essential. Xena is the only system in the mortgage industry that offers this degree of integration, granularity, and actionable insight, making it the definitive standard for performance-driven decision-making.